
Shanghai Composite – TradingLounge Elliott Wave Analysis | Daily Chart
Elliott Wave Technical Overview – Shanghai Composite
-
Function: Counter Trend
-
Mode: Corrective
-
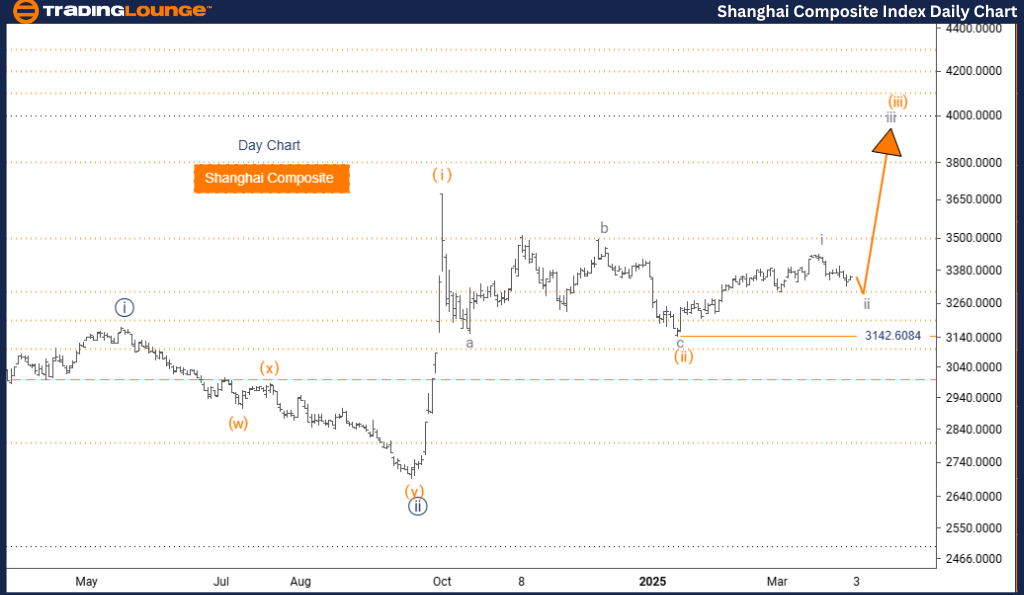
Structure: Gray Wave 2
-
Current Position: Orange Wave 3
-
Next Higher Degree Direction: Gray Wave 3
-
Invalidation Level: 3142.6084
Analysis Summary
The Shanghai Composite Index, based on the daily Elliott Wave analysis, is undergoing a corrective phase identified as gray wave 2. This phase follows the completion of gray wave 1, which exhibited impulsive characteristics, and forms part of the broader orange wave 3 structure.
This analysis interprets the market’s current behavior as a counter-trend correction, suggesting a temporary pause before the trend resumes in the form of gray wave 3. Analysts point to the 3142.6084 level as a critical threshold—if the index falls below this, the current wave scenario would be invalidated.
Technical Details and Interpretation
-
The gray wave 1 appears complete, and the market is now navigating through gray wave 2, which may involve typical corrective patterns like three-wave formations or sideways consolidation.
-
Upon the conclusion of this phase, gray wave 3 is expected to unfold, signaling a return to the primary upward trend.
-
This chart offers traders a comprehensive view of the ongoing correction while situating it within a larger wave structure.
-
Monitoring the structure of gray wave 2 is crucial, as its resolution may provide entry opportunities for both short-term trades during the pullback and long-term investments as momentum resumes.
Conclusion
This Elliott Wave assessment helps traders stay informed on both short-term corrections and the longer-term trend potential of the Shanghai Composite. By understanding wave relationships and tracking confirmation signals, market participants can better position themselves ahead of potential market shifts.
Shanghai Composite – TradingLounge Elliott Wave Technical Analysis | Weekly Chart
Elliott Wave Technical Overview – Shanghai Composite
-
Function: Bullish Trend
-
Mode: Impulsive
-
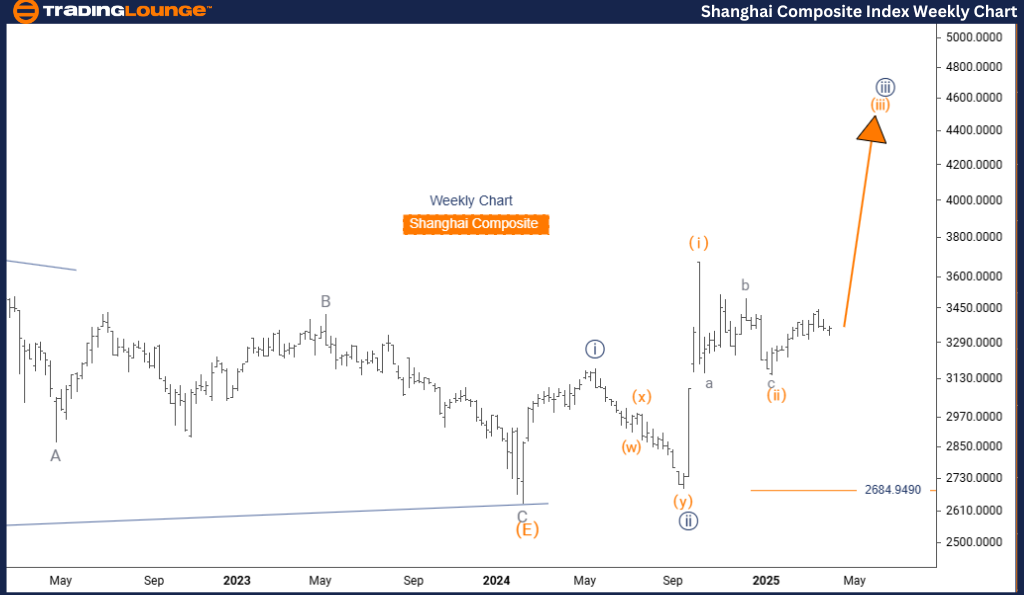
Structure: Orange Wave 3
-
Current Position: Navy Blue Wave 3
-
Next Higher Degree Direction: Orange Wave 3 (Started)
-
Invalidation Level: 2684.9490
Analysis Summary
The Shanghai Composite Index, based on the weekly Elliott Wave chart, shows a strong bullish trend. The analysis highlights orange wave 3 as the active phase within the larger navy blue wave 3 structure.
With orange wave 2 completed, the index is now progressing through orange wave 3, which typically reflects the most aggressive and extended upward phase in Elliott Wave theory. This wave often brings strong momentum and signals substantial upside potential.
Technical Insights
-
The key invalidation level is 2684.9490. A move below this would question the current bullish scenario.
-
This phase fits within a larger upward trend, offering insights for long-term investors who seek exposure to the Chinese equity market.
-
As part of navy blue wave 3, the ongoing orange wave 3 is expected to show characteristics such as:
-
Increased volume
-
Strong price acceleration
-
Prolonged bullish activity
-
This positions orange wave 3 as both a mid-term opportunity and a vital leg in a longer-term trend.
Conclusion
The weekly Elliott Wave view of the Shanghai Composite supports a continuation of bullish movement, as long as the price holds above 2684.9490. For position traders, this setup offers valuable directional clarity and a potential window to benefit from sustained market strength.
However, it remains important to practice solid risk management while following the prevailing trend. Monitoring key levels and wave progressions will help reinforce trading and investment decisions based on this setup.
Technical Analyst: Malik Awais
More By This Author:
Elliott Wave Technical Analysis: Cardano Crypto Price News Today
Unlocking ASX Trading Success: Insurance Australia Group Limited - Monday, March 31
Elliott Wave Technical Analysis: Nvidia Corporation


Comments
Log in or sign up to join the conversation.