
Ranked: These Are 10 Of The World’s Least Affordable Housing Markets
The US doesn't start appearing on the list til number 4 - but to make up for it, is the only country to place four cities in the global top 10.
It’s become increasingly difficult for middle-class families to purchase a home over the last few years—and the global pandemic has only made things worse.
According to Demographia’s 2022 Housing Affordability Report, the number of housing markets around the world deemed “severely unaffordable” increased by 60% compared to 2019 (prior to the pandemic).
This graphic looks at some of the least affordable housing markets across the globe, relative to median household income. The report covers 92 different cities in eight nations: Australia, Canada, China, Ireland, New Zealand, Singapore, the United Kingdom, and the United States.
The Least Affordable Housing Markets
Before diving in, it’s worth outlining the methodology used in this report, to help explain what’s classified as a severely unaffordable housing market.
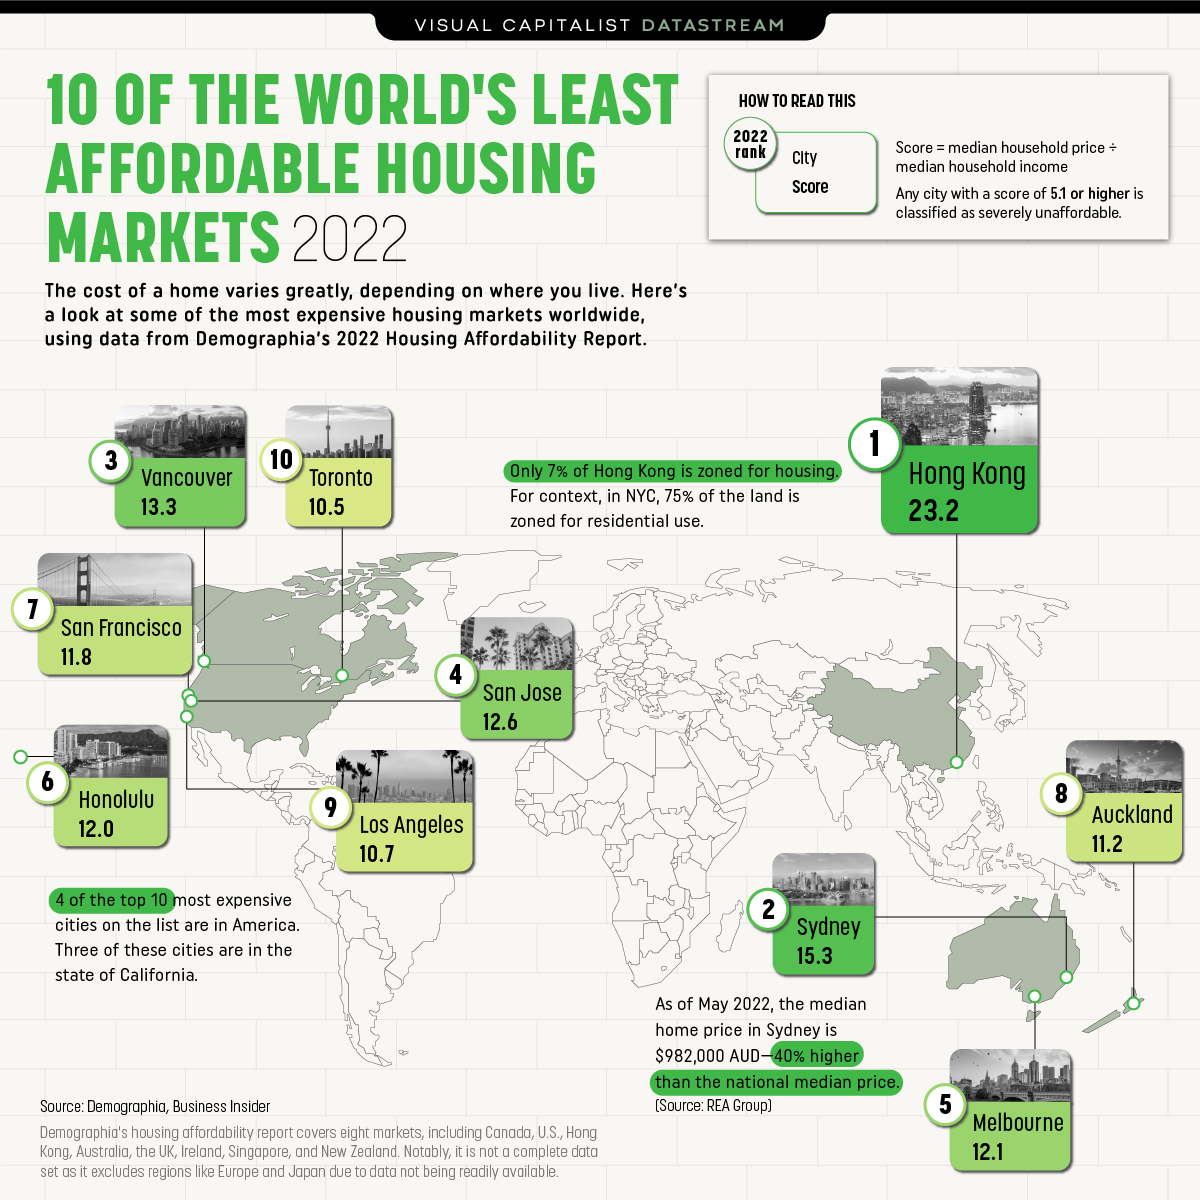
To calculate affordability, a city’s median housing price and divided by its median household income. From there, a city is given a score:
- A score of 5.1 or above is considered severely unaffordable
- 4.1 to 5.0 is considered seriously unaffordable
- 3.1 to 4.0 is considered moderately unaffordable
All the cities on this graphic are classified as severely unaffordable—and, for the 12th year in a row, Hong Kong takes the top spot as the world’s most unaffordable housing market, with a score of 23.2.
| HOUSING MARKET | NATION | SCORE |
|---|---|---|
| Hong Kong |  Hong Kong (SAR) Hong Kong (SAR) |
23.2 |
| Sydney, NSW |  Australia Australia |
15.3 |
| Vancouver, BC |  Canada Canada |
13.3 |
| San Jose, CA |  U.S. U.S. |
12.6 |
| Melbourne, VIC | Australia |
12.1 |
| Honolulu, HI | U.S. |
12.0 |
| San Francisco, CA | U.S. |
11.8 |
| Auckland, AUK |  New Zealand New Zealand |
11.2 |
| Los Angeles, CA | U.S. |
10.7 |
| Toronto, ON | Canada |
10.5 |
Sydney moved up one spot this year, making it the second most expensive city to purchase a home on the list, with a score of 15.3. Besides Hong Kong, no other city has scored this high in the last 18 years this report has been released.One reason for Hong Kong’s steep housing costs is its lack of supply, partly due to its lack of residential zoning—which only accounts for 7% of the region’s zoned land. For context, 75% of New York City’s land area is dedicated to residential housing.
There are several theories for Sydney’s soaring housing rates, but industry expert Tom Forrest, CEO of Urban Taskforce Australia, boils it down to one fundamental issue in an interview with Australia Broker—supply isn’t keeping up with demand:
“Housing supply has been consistently not meeting demand in the Greater Sydney and across regional New South Wales…if you have supply consistently not meeting demand then the price will go up. That’s what happened and we’re seeing it in abundance.”TOM FORREST, CEO OF URBAN TASKFORCE AUSTRALIA
The COVID-19 Impact
Middle-income earners were already feeling the squeeze prior to the global pandemic, but COVID-19 only exacerbated housing affordability issues.
As people began to work from home, high-income earners started to look for more spacious housing that wasn’t necessarily in the city center, driving up demand in suburban areas that were relatively affordable prior to the pandemic.
At the same time, supply chain issues and material costs impacted construction, which created a perfect storm that ultimately drove housing prices up.
But with interest rates rising and COVID-19 restrictions easing around the world, some experts are predicting a market cool down this year—at least in some parts of the world.
Where does this data come from?
Source: Demographia
Details: The affordability score is calculated by taking a city’s median housing price and dividing it by the median household income. Anything over 5.1 is considered severely unaffordable
Notes: Data includes 92 metropolitan markets across eight countries; Australia, Canada, Ireland, Singapore, China, New Zealand, the U.K., and the U.S., as of the third quarter of 2021. Many European countries, along wth Japan, we excluded from the dataset, because information on median income was not readily available.
Disclosure: None.


