
(Click on image to enlarge)
Key Takeaways
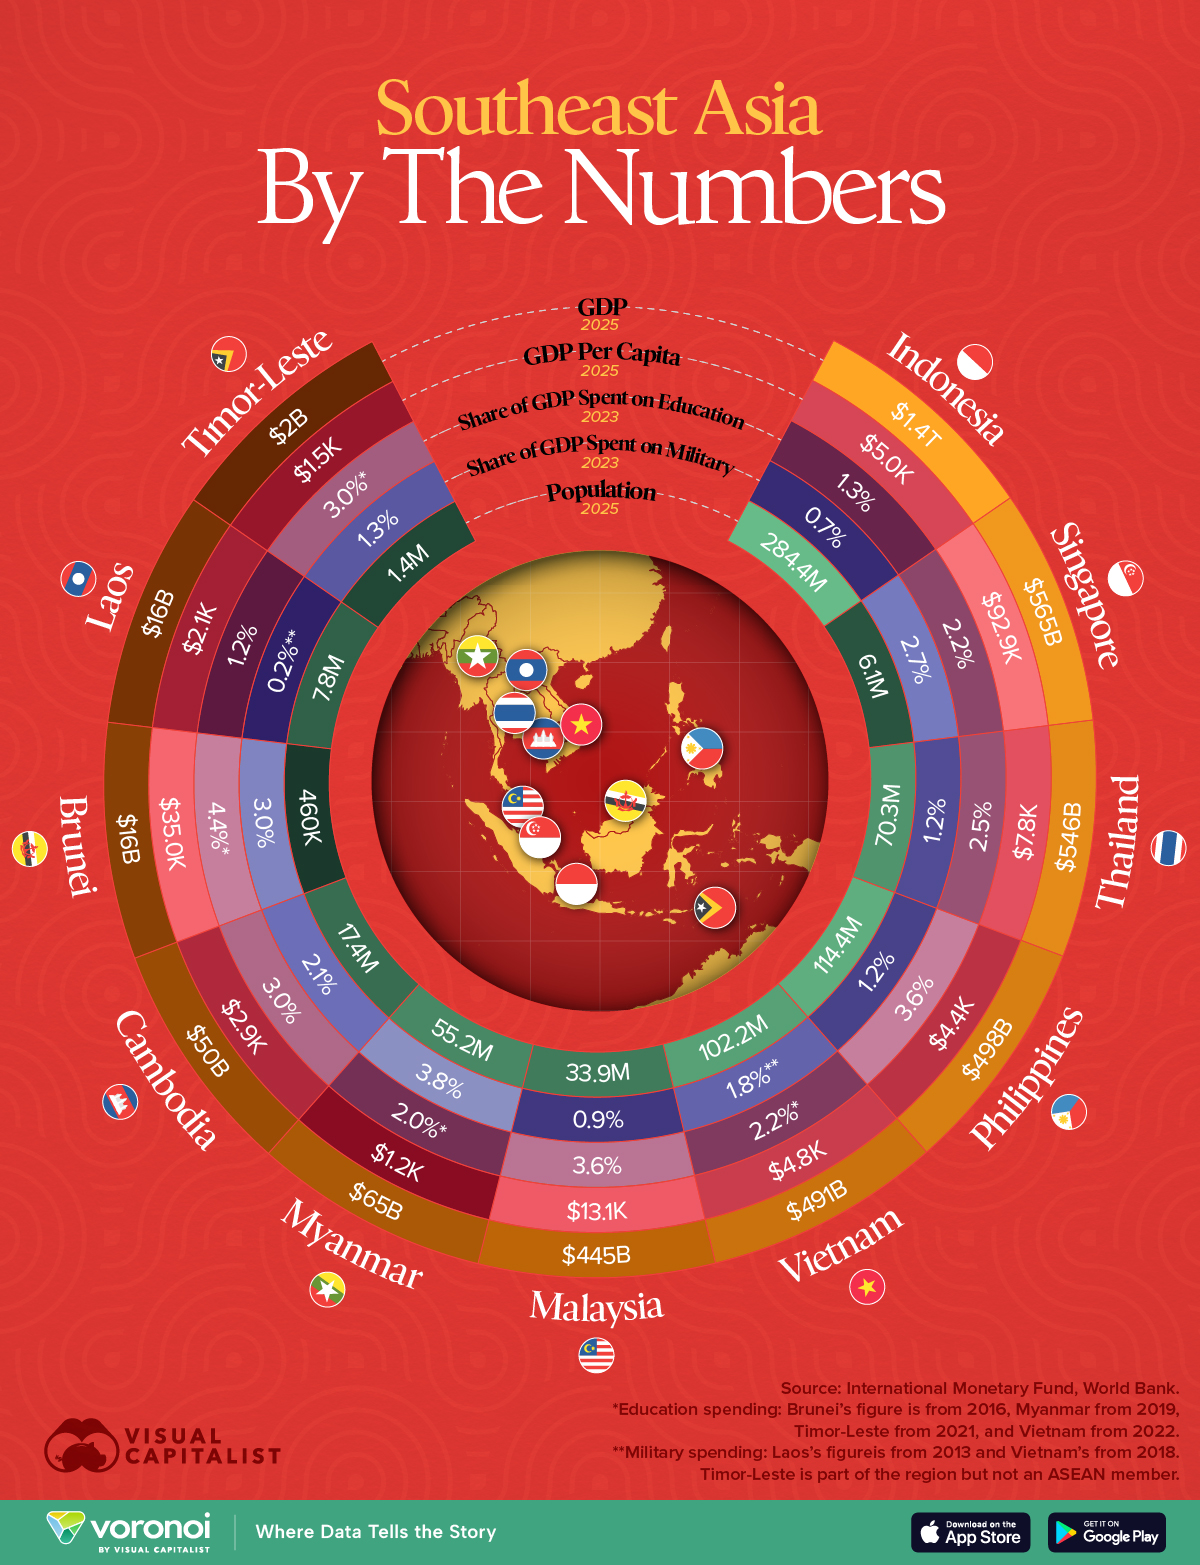
- Indonesia leads Southeast Asian countries in its $1.4 trillion GDP, driven by sheer population size (284 million people).
- On the other hand, Singapore has only 6.1 million people, and has built a $565 billion economy (with the region’s highest GDP per capita at nearly $93,000.)
Southeast Asia is a perfect microcosm of the world economy in many ways, in that it’s a region of stark contrasts.
In this infographic, we compare 11 Southeast Asian countries by GDP, GDP per capita, population, and their public spending on education and military.
The data for this visualization comes from the International Monetary Fund using 2025 figures for GDP, GDP per Capita, and population.
Public spending figures are from the World Bank and use the latest year available, listed on the infographic and in the tables in the next section.
Indonesia: Southeast Asia’s Largest Economy
Indonesia dominates in size, with a $1.4 trillion GDP in and 284 million people in 2025.
| SEA Country | GDP (2025) | Population (2025) | GDP Per Capita (2025) |
|---|---|---|---|
| 🇮🇩 Indonesia | $1.4T | 284.4M | $5.0K |
| 🇸🇬 Singapore | $565B | 6.1M | $92.9K |
| 🇹🇭 Thailand | $546B | 70.3M | $7.8K |
| 🇵🇭 Philippines | $498B | 114.4M | $4.4K |
| 🇻🇳 Vietnam | $491B | 102.2M | $4.8K |
| 🇲🇾 Malaysia | $445B | 33.9M | $13.1K |
| 🇲🇲 Myanmar | $65B | 55.2M | $1.2K |
| 🇰🇭 Cambodia | $50B | 17.4M | $2.9K |
| 🇧🇳 Brunei | $16B | 460K | $35.0K |
| 🇱🇦 Laos | $16B | 7.8M | $2.1K |
| 🇹🇱 Timor-Leste | $2B | 1.4M | $1.5K |
But its GDP per capita stands at just $5,000—lower than regional peers like Malaysia or Thailand.
This reflects the country’s large rural population and development disparities.
Despite its scale, Indonesia invests just 1.3% of GDP in education and 0.7% in defense, among the region’s lowest.
Singapore: Small but Mighty
On the other hand, Singapore exemplifies how economic strategy can outweigh size.
With just 6.1 million residents, it boasts a GDP of $565 billion.
It has the highest per capita GDP in the region, and is top four in the world, at nearly $93,000.
It also allocates 2.2% of GDP to education and 2.7% to defense, suggesting a strong focus on human capital and security.
| SEA Country | Share of GDP Spent on Education (2023) |
Share of GDP Spent on Military (2023) |
|---|---|---|
| 🇧🇳 Brunei | 4.4%* | 3.0% |
| 🇵🇭 Philippines | 3.6% | 1.2% |
| 🇲🇾 Malaysia | 3.6% | 0.9% |
| 🇰🇭 Cambodia | 3.0% | 2.1% |
| 🇹🇱 Timor-Leste | 3.0%* | 1.3% |
| 🇹🇭 Thailand | 2.5% | 1.2% |
| 🇸🇬 Singapore | 2.2% | 2.7% |
| 🇻🇳 Vietnam | 2.2%* | 1.8%** |
| 🇲🇲 Myanmar | 2.0%* | 3.8% |
| 🇮🇩 Indonesia | 1.3% | 0.7% |
| 🇱🇦 Laos | 1.2% | 0.2%** |
Note: All figures are latest available, but dates vary for specific countries, listed here. *Education spending: Brunei’s figure is from 2016, Myanmar from 2019, Timor-Leste from 2021, and Vietnam from 2022. **Military spending: Laos’s figure is from 2013 and Vietnam’s from 2018. Timor-Leste is part of the region but not an ASEAN member.
Singapore’s model highlights the power of a knowledge-based, trade-driven economy.
High Spenders on Education and Defense
Brunei stands out for spending 4.4% of its GDP on education (though this measurement is from 2016) and 3.0% on the military—both among the highest in the region.
Similarly, the Philippines and Malaysia dedicate 3.6% each to education, despite much lower GDP per capita.
Myanmar, though economically struggling, spends 3.8% of GDP on defense, the region’s highest.
These patterns reveal differing national priorities, from education-driven development to military focus amid internal tensions.
More By This Author:
Mapped: Every Robotaxi Service Operating In 2025Visualizing The Top Emerging Technologies Of 2025
Visualizing Uber’s Surge In Rides And Users (2015-2024)


Comments
Log in or sign up to join the conversation.