Pairs In Focus This Week - Sunday, Oct. 22
Image Source: Unsplash
S&P 500
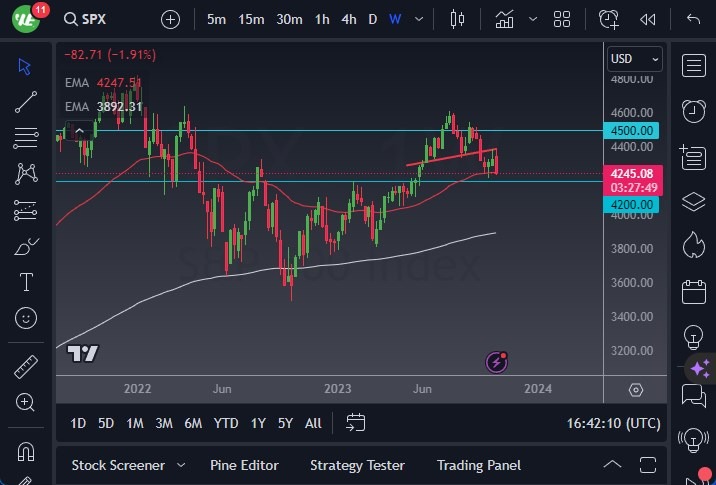
The S&P 500 had a tough week, as it initially tried to rally before its attempt fell apart. At this point, it looks like the S&P 500 is trying to test the 4200 region, an area that also is backed up by the 50-week EMA. This is a market that I think will continue to see a lot of noise, but this is an area that may also experience a bit of a bounce. Currently, we are in the midst of the Q3 earnings season, so that in and of itself will cause quite a bit of noise.
If we do see a break down below the 4200 level, then it would be possible to see a move to the 4100 level. On the other hand, if we do see a rally, a short-term ceiling closer to the 4400 level would possibly form. Either way, it will likely be very noisy.
(Click on image to enlarge)
EUR/USD
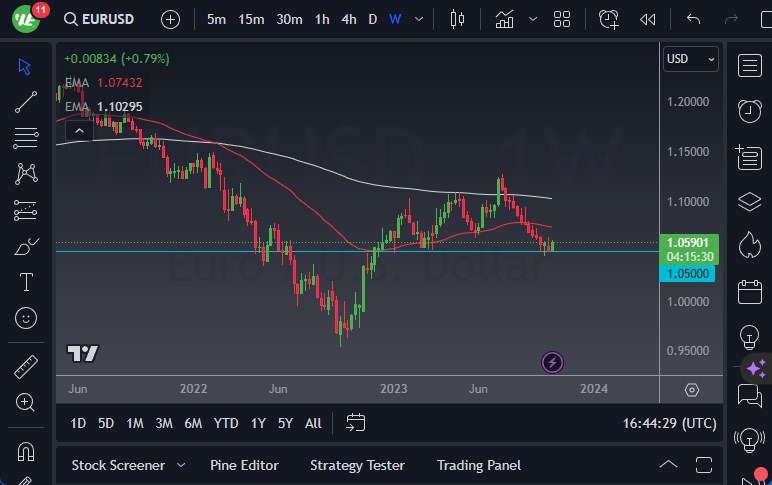
The euro initially tried to break down a bit at the start of the week, but it then turned around to show signs of life. Nonetheless, it appears to be in a consolidation region, and the 1.05 level underneath continues to be a major support level. It's a large, round, psychologically significant figure as well, and therefore I think it will attract a lot of attention if we do see a break down below there.
On such a breakdown, I would anticipate the euro to go looking to the 1.0250 level. On the other hand, if we see a break above the 1.0650 level, the euro could then go looking toward the 1.0750 region.
(Click on image to enlarge)
USD/CAD
The US dollar has been slightly positive against the Canadian dollar during the week, but there is still lot of resistance near the 1.38 level. The 1.38 level is an area that has caused a significant amount of resistance. A break above that level could open up a move to the 1.40 mark. However, a pullback at this point could cause the 1.35 level to form potential support. Keep in mind that oil does have an influence on the Canadian dollar, as well.

(Click on image to enlarge)
Copper
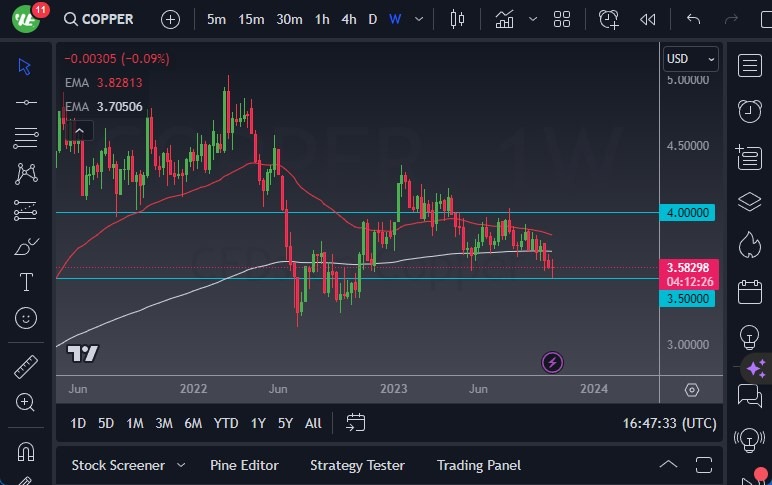
Copper markets have steadily declined over the last couple of weeks, and they now appear to be testing the $3.50 level for support. This is an area that a lot of people will be paying attention to, as a break down below there that point would open up a move down to the $3.25 level. Keep in mind that copper is crucial when it comes to the global economy, so it could potentially serve as a proxy for global growth.
If we were to see a break above the $3.65 level, there may be a bit of a relief rally. However, the $4.00 level would be a very difficult point to break above, and I believe it it may serve more as a market ceiling at the moment.
(Click on image to enlarge)
AUD/USD
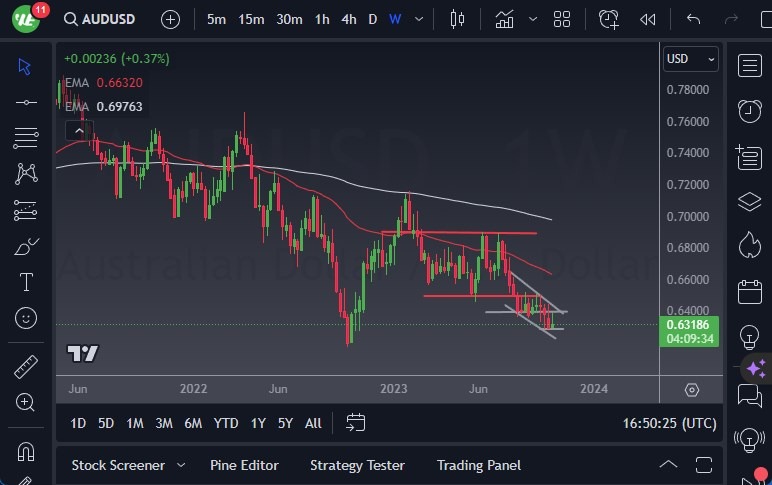
The Australian dollar initially tried to rally during the course of the week, but it continued to find a lot of trouble near the 0.64 level. This level has been a significant one previously, so it’s not a huge surprise that it has come into the picture again.
Ultimately, the Australian dollar ended up forming a bit of an inverted hammer, which could lead to further negativity. Though, if it could turn around and break above the top of the recent candles, such a move could lead to a bit of a relief rally. Keep in mind that the Aussie is highly sensitive to global growth, so you need to be aware of how the economy is faring globally. It certainly looks like rallies may continue to be sold into.
(Click on image to enlarge)
GBP/USD
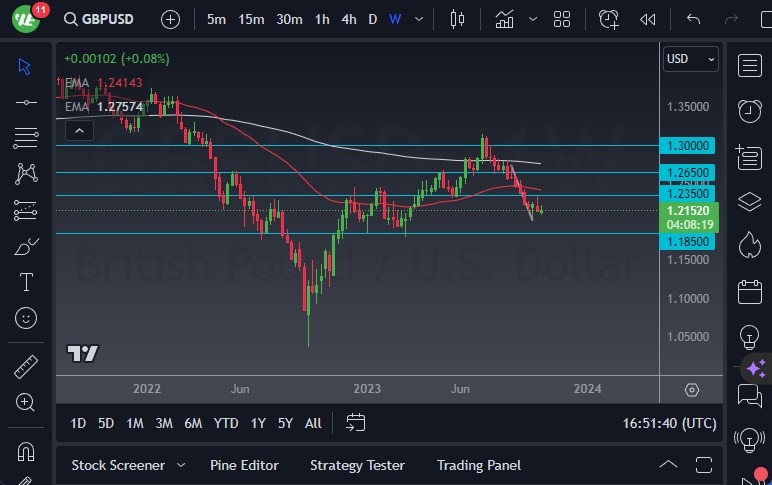
The British pound experienced a relatively choppy week. The most important level on the chart is the 1.2350 mark because it looks as though it is offering a bit of the ceiling. Underneath, the 1.1850 level could be a significant support level, as it has previously offered support from several months ago. At this point, the market is obviously very negative, so short-term rallies will probably continue to attract a lot of selling pressure.
(Click on image to enlarge)
Nasdaq 100
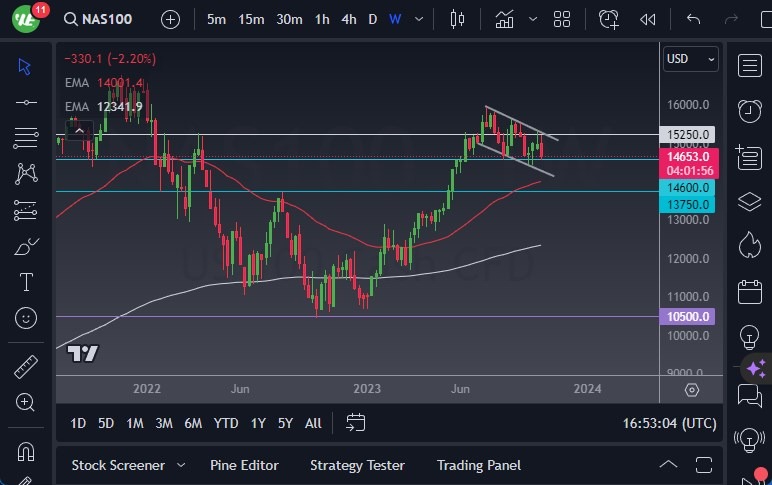
The Nasdaq 100 initially tried to rally for the week, but it found enough trouble at the 15,250 level to turn around and show signs of negativity. At this point, the 14,600 level is a significant support level, but breaking down below there could kick off even more selling pressure.
If it were to turn around and take out the 15,250 level, then this would be a very bullish sign that could send this market much higher. I think that the 16,000 level may get targeted next. Keep in mind that we are in the midst of Q3 earnings, so there will be a lot of volatility regardless.
(Click on image to enlarge)
USD/SEK
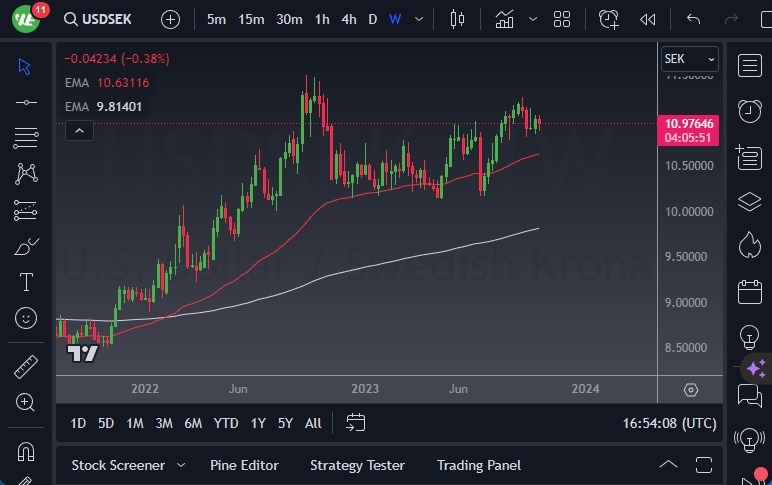
The US dollar continued to grind sideways around the 10.98 level, but it appears as though it may try to breach the 11.00 region. If it is able to do so, then the market would likely head much higher.
On the other hand, if we see a break down below 10.80, then it could go looking toward the 50-day EMA near the 10.63 level. Either way, the US dollar continues to look as if it is going to strengthen over the longer-term.
(Click on image to enlarge)
More By This Author:
S&P 500 Forecast: Navigates Earnings SeasonGold Forecast: Sees Geopolitical Pressures
GBP/USD Forecast: Navigates Challenging Waters
Disclosure: DailyForex will not be held liable for any loss or damage resulting from reliance on the information contained within this website including market news, analysis, trading signals ...
more


