Pairs In Focus This Week - Sunday, Oct. 15
Image Source: Unsplash
USD/JPY
The US dollar pulled back a bit during the course of the trading week, but it found enough support near the JPY 148 region to turn around and show signs of life. Ultimately, it looks like it is trying to break above the JPY 150 level, but it may take a while to make that happen. This is a market that still has plenty of buyers underneath this level, and therefore it would be likely to see more of a “buy out the dip” mentality going forward.
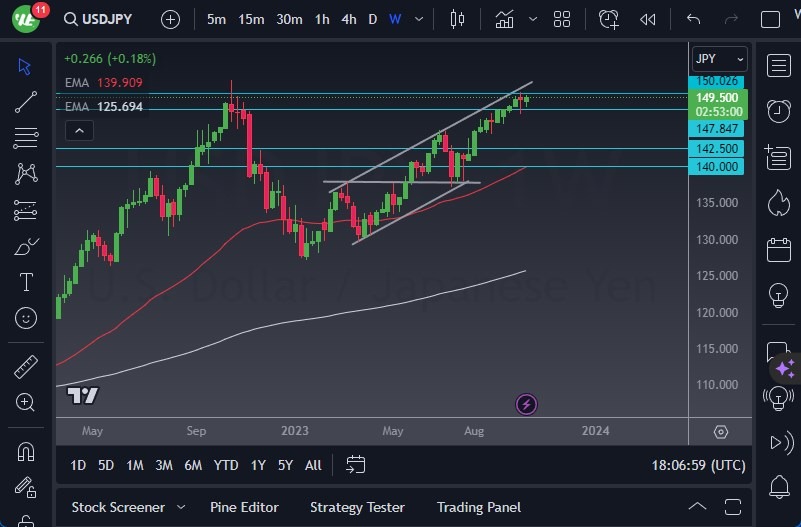
(Click on image to enlarge)
EUR/USD
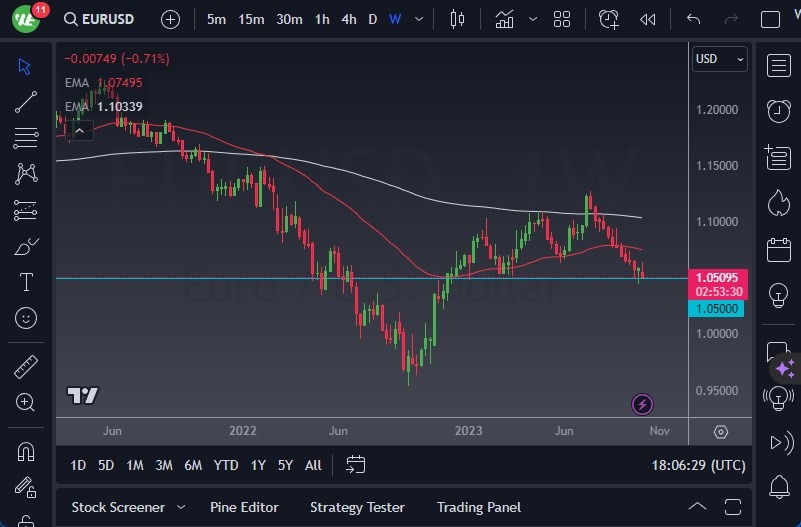
The euro initially tried to rally during the trading week, but it got absolutely crushed as bond yields in America continued to be a major driver of markets. With this being the case, if we see a break down below the previous weekly candlestick, then I think a free-fall toward the 1.0250 level, or possibly even lower than that, could be possible given enough time.
If we were to see a break above the top the candlestick for the week, it could then make a move toward the 1.07 level.
(Click on image to enlarge)
Gold
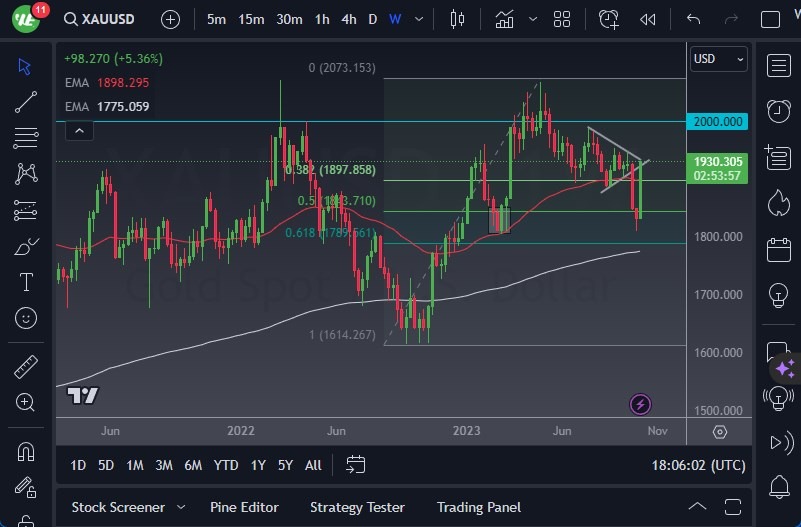
Gold markets had a monster week, as it shot straight up in the air. It looks like the market is going to struggle in this general vicinity, so it would not be surprising at all to see a little bit of a pullback. This is a little bit of a panic move, so that pullback makes a bit of sense. Whether or not it is a tradable event remains to be seen, but it is something to keep in the back of your mind.
(Click on image to enlarge)
WTI Crude Oil (US Oil)
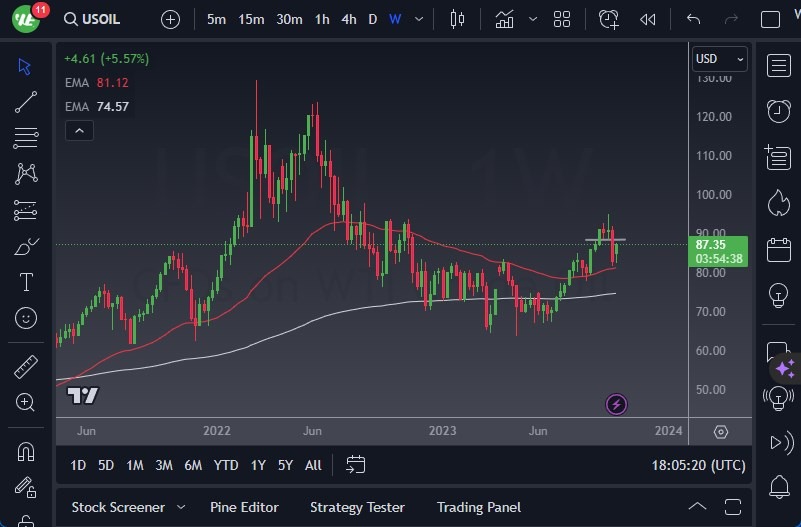
The crude oil market had initially fallen during the week, only to turn around and show signs of life again. It looks to be heading toward the $90 level, and the 50-week EMA underneath will continue to be a major driver of where the commodity heads next. That point has offered a significant amount of support, and I think that will continue to be the case. If we were to see a break down below the $80 level, that could cause chaos.
(Click on image to enlarge)
Nasdaq 100
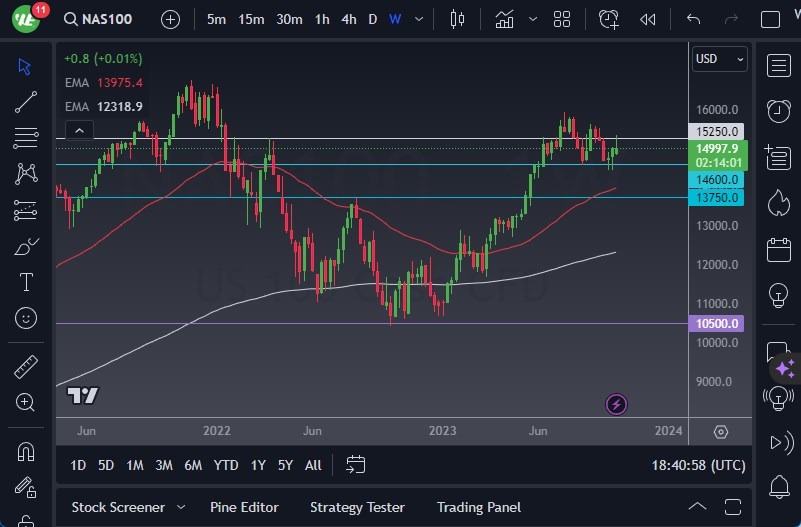
The Nasdaq 100 initially tried to break out during the week, but it got absolutely crushed on Friday. That being said, it looks to be setting up for some type of consolidation.
One should pay close attention to the bottom of the candlestick because if we were to see a break down below there, it could plunge toward the 13,750 level. On the other hand, if the top of the candlestick for the past week was to be taken out, such a move could confirm a bullish flag and we could see it go much, much higher.
(Click on image to enlarge)
Silver
Silver markets, much like gold, shot straight up in the air. However, the metal looks set to face quite a bit of noise just above. At the first signs of exhaustion, I might throw a small position out there on the short side.
Quite frankly, silver does not carry the same safe haven bid as gold, and there are a lot of industrial concerns at the moment. Having said that, if it were to clear the $24 level, such a move could send this market racing to the upside. The size of the candlestick is somewhat impressive, but there is still a lot of traffic to get through.

(Click on image to enlarge)
USD/CAD
As mentioned earlier, the US dollar initially fell during the trading week before turning around to show signs of life again. It appeared to be trying to reach the 1.38 level, which is the top of the overall consolidation range that the US dollar has been in while trading against the Canadian dollar.
A break above that point would open up the possibility of a move to the 1.40 level. On the other hand, if we were to see a break down below the bottom of the candlestick for this past week, that could open up a move down to the 1.34 level where the 50-week EMA resides.

(Click on image to enlarge)
BTC/USD
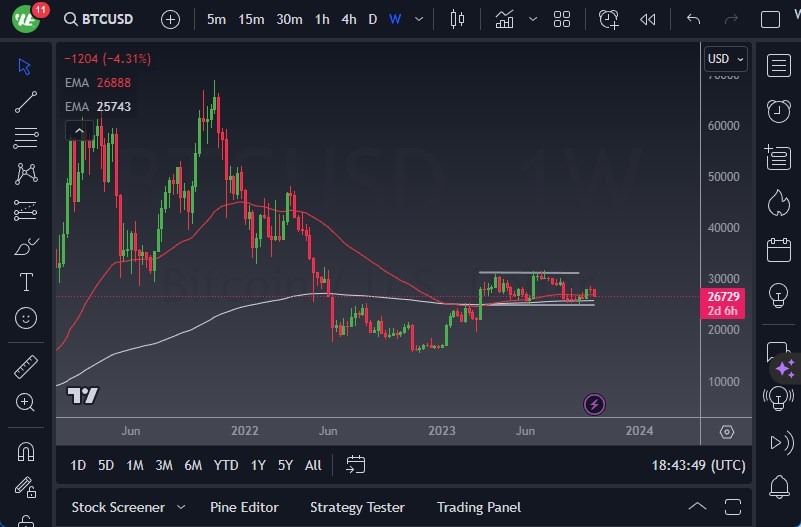
Bitcoin seemingly continues to be the place where money goes to die. We really haven’t seen it do much since March, and this past week was no different. However, if we were to see a break down below the $24,800 level, the downward pressure would only continue.
On the other hand, if Bitcoin breaks above the $30,000 level, then it’s likely that it could test the $31,500 level over the longer-term. With this, I believe there may be more consolidation ahead as we wait to see what happens next with crypto in general.
(Click on image to enlarge)
More By This Author:
USD/JPY Forecast: Shows Resilience Amid Interest Rate DifferentialGold Signal: Markets Navigate Uncertainty Amid CPI Surges
Crude Oil Forecast: Markets Show Resilience Amid Geopolitical Concerns
Disclosure: DailyForex will not be held liable for any loss or damage resulting from reliance on the information contained within this website including market news, analysis, trading signals ...
more


