Pairs In Focus This Week - Sunday, March 5
Image Source: Unsplash
GBP/USD
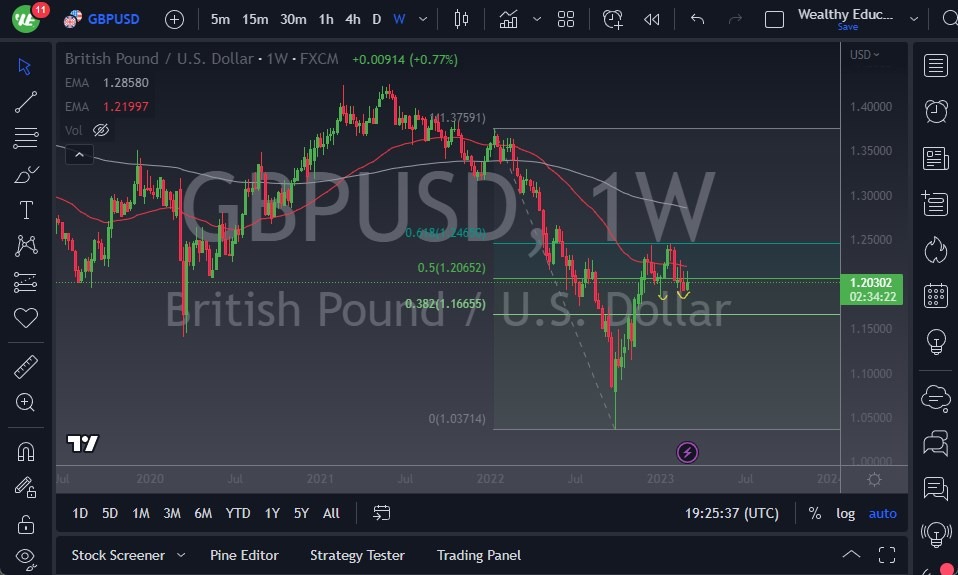
The GBP/USD currency pair rallied a bit during the trading week to show initial signs of life, but it has given back those gains yet again. Ultimately, this is a market that continues to be very noisy, so keep that in mind.
However, the one thing that I continue to see in this market is that every time this pair rallies, sellers get involved and start pushing lower. Whether or not the pair can break down remains to be seen, but it continues to be contained in a “fade the rally” market.
EUR/USD
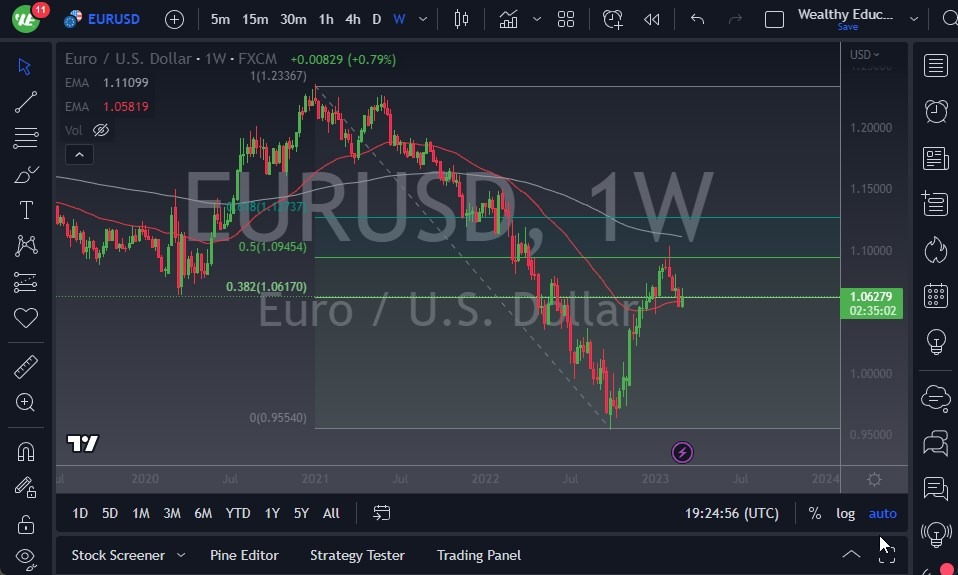
The EUR/USD currency pair also rallied during the week, but it looks as though the pair may hesitate. The 1.06 level continues to be a bit of a magnet for price; therefore, I think it will continue to see a lot of noise.
If the pair were to break down below the weekly bottom, such a move would open up the possibility of a further move down to 1.03, followed by parity. This certainly looks like a market that is struggling to find enough momentum to go higher, and I just don't see how the pair could break out to the upside. The market continues to fluctuate, and it is worth noting that when the pair rallied, it peaked at the 50% Fibonacci level.
Gold
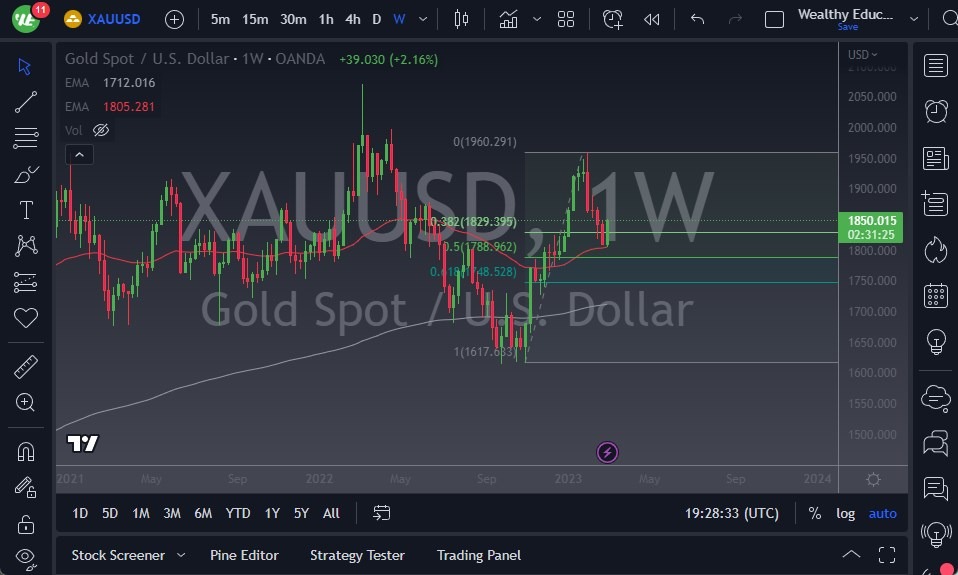
Gold markets have rallied during the course of the week, bouncing from the 50-week EMA. The market looks likely to continue going higher after experiencing a significant pullback. That being said, the yellow metal may rally at the same time as the US dollar.
I also recognize that the $1900 level is a major resistance barrier based upon the daily chart, as gold has formed several inverted hammers in a row in that area. If it were to smash through that level, it could rise back towards the highs. In the case of a pullback, I expect the 50-week EMA to offer a bit of support underneath.
USD/JPY
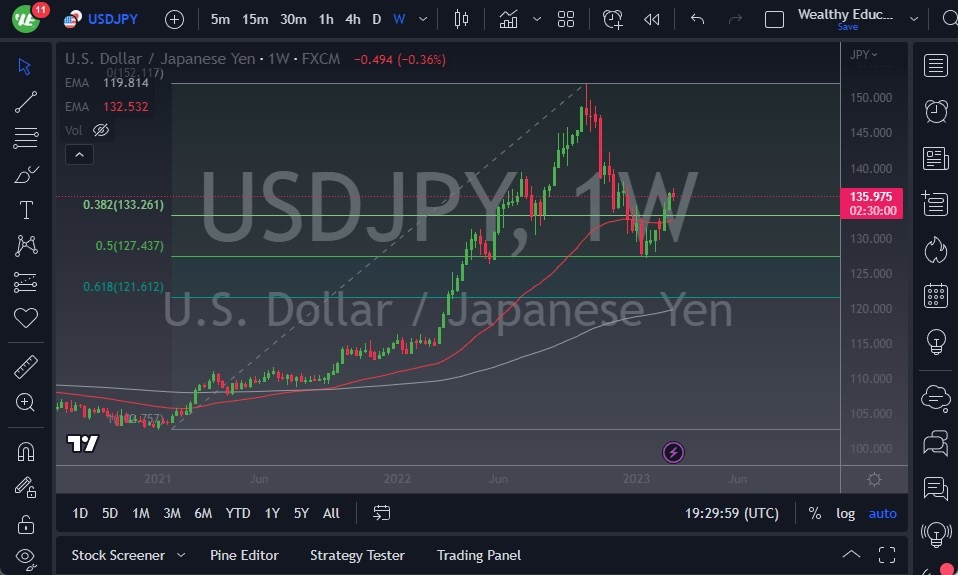
The USD/JPY pair pulled back slightly against the Japanese yen during the trading week, as it appears to have finally run out of momentum. It’s worth noting that the pair had previously bounced from 50% of the retracement level, and even formed a double bottom on the daily chart.
At this point, the market is going to continue to see the JPY136 level as a barrier. If the pair were to break above there, then the market could go looking to the JPY140 level, or possibly even back to the highs, given enough time. Remember that the Bank of Japan continues to fight interest rates rising, as the 10-year yield has a cap of 50 basis points. Therefore, the BoJ will continue to print yen, flooding the currency market with the asset.
AUD/USD
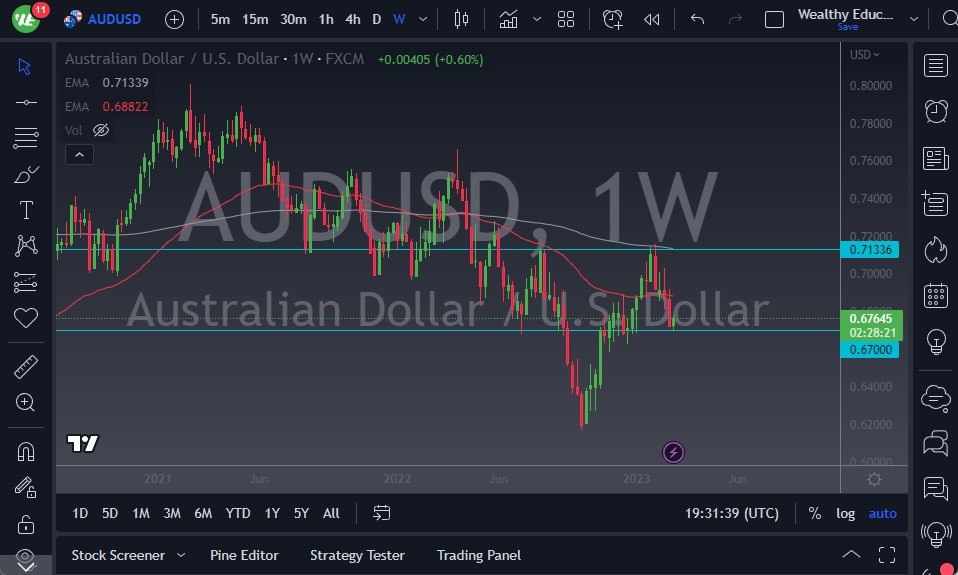
The AUD/USD currency pair rallied a bit against the US dollar over the past week, and the market continues to see the 0.67 level as a major support level, just like the end of last year. If the pair were to break down below the 0.67 level, then it’s likely that the Australian dollar would continue to fall.
That being said, I personally look at rallies as short-term selling opportunities, especially with the 50-week EMA sitting closer to the 0.69 level offering resistance.
NZD/USD
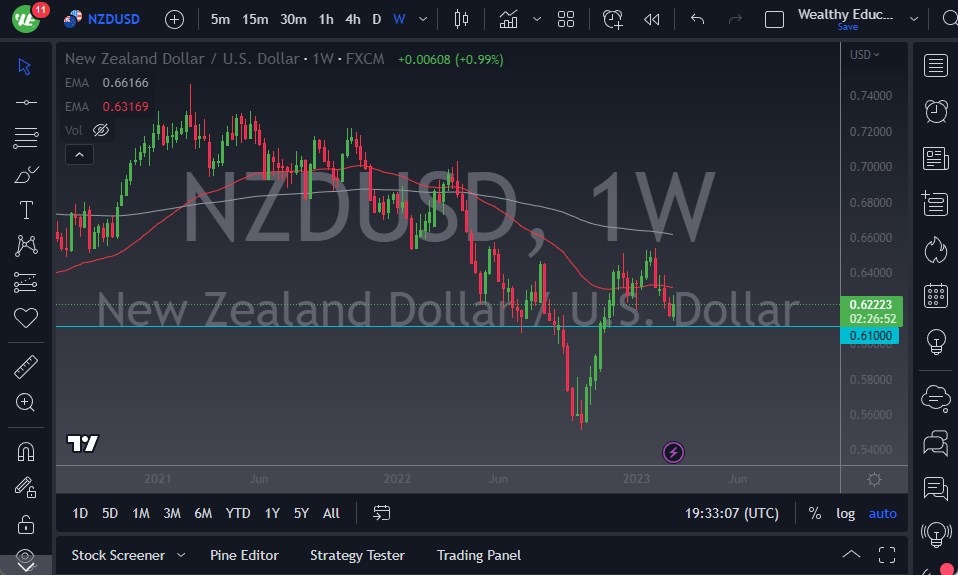
The NZD/USD currency pair similarly rallied during the course of the week, but it gave back some the gains on Friday. At this point, it looks as though traders are going to have to pay close attention to the 0.61 level, as it offered significant support. If the pair were to break down below there, then the market would probably go looking to the 0.60 level next, possibly even further down to the 0.58 level.
I have no interest in buying this pair anytime soon, as it looks like the US dollar will continue to show signs of resiliency. Keep in mind that the New Zealand dollar is highly sensitive to risk appetite around the world, so you need to pay close attention to that, as well.
S&P 500
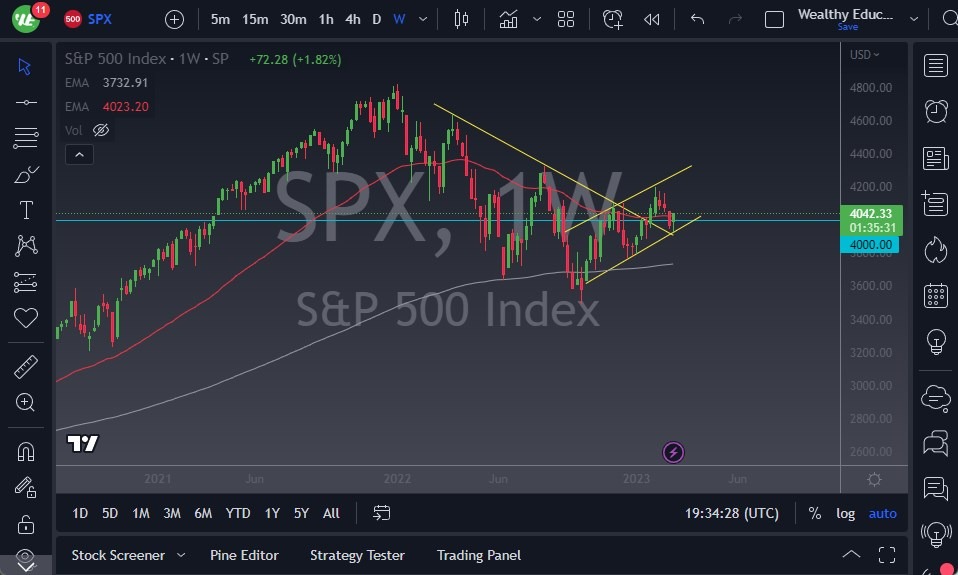
The S&P 500 experienced a bullish week after initially pulling back to test the previous trendline. At this point in time, this is a market that continues to see a lot of noise. And, of course, the 4000 level is an area that traders will have to pay close attention to, as well.
Rallies at this point in time will have to deal with a couple of shooting stars that sit right around the 4200 level, so I think that’s an area that is probably going to prove to be a bit of the ceiling. If the index could break down below the bottom of the weekly candlestick that was just printed, then it could even go down to the 3900 level.
Silver
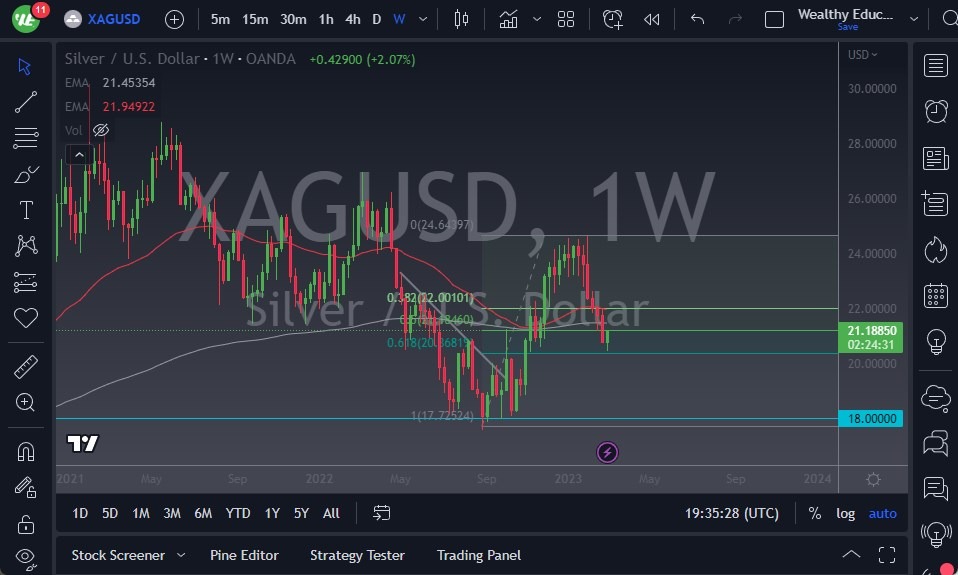
Silver markets have fallen a bit during the trading week to test the 61.8% Fibonacci level. At this point, it looks like as though it is trying to recover, and it did manage to close the week at absolute highs.
With that being the case, I think the metal may have a bit of follow-through, and it’s very likely that it could target the $22 level sometime this coming week. I don’t have any interest in shorting, but if it were to break down below the candlestick, then I think it could challenge the $20 level.
More By This Author:
EUR/USD: Weekly Forecast 5th March - 11th MarchGold Forecast: Looking To Break Above The 50-Day EMA
Gold Forecast: Gold Is Making An Argument For Higher Pricing
Disclosure: DailyForex will not be held liable for any loss or damage resulting from reliance on the information contained within this website including market news, analysis, trading signals ...
more


