

Image Source: Unsplash
EUR/USD
The EUR/USD currency pair initially shot higher during the week, bolstered by the post-FOMC reaction as traders decided that the Federal Reserve may start to slow down. Quite frankly, that reaction has since been beaten back, and now the currency pair has formed a massive shooting star in the weekly chart.
This seems to suggest that any time the euro starts to rally a bit, one may be rewarded for finding some type of exhaustion that can be sold into. The 1.05 level appears to be a hard floor, but if the pair were to break down below there, it could open up the floodgates.

Gold
Gold markets have fallen quite drastically during the trading week, only to turn around and form a huge hammer. The hammer, of course, is pressing against the major resistance barrier in the form of $2000 or so, but if the metal can break above the top of the candlestick, it’s likely that it could go looking toward the $2100 level.
That being said, if the yellow metal were to break down below the bottom, that would open up selling pressure, perhaps allowing gold to drop down to the $1900 level.

GBP/USD
The GBP/USD pair initially tried to rally during the course of the trading week, but the duo got repudiated at every attempt. By the time it got to the end of the week, it became obvious that such exhaustion will only continue, and the best way to play this market will be to short the British pound if it does rally.
If the pair were to break down below the bottom of the candlestick, it could be possible to to see the pair move further down to the 1.20 level, an area that I think is quite supportive. On the other hand, if it were to break above the 1.25 level, that would obviously be a very bullish sign, opening up a longer-term “buy-and-hold” possibility.

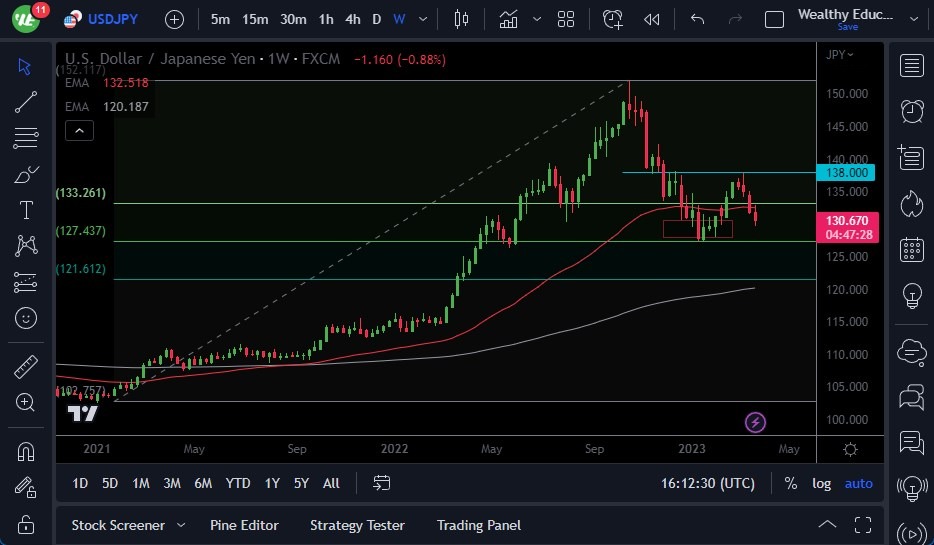
USD/JPY
The USD/JPY currency pair also initially tried to rally during the week, breaking above the 50-week EMA. However, the pair turned around to show signs of exhaustion, and now it looks like the pair is ready to go down to the JPY130.50 level.
However, keep in mind that the market is highly sensitive to the overall attitude of bond markets, as the Bank of Japan continues to work against the interest rate markets. If the pair manages to break above the top of the candlestick, it’s likely that it could reach the JPY138 level.
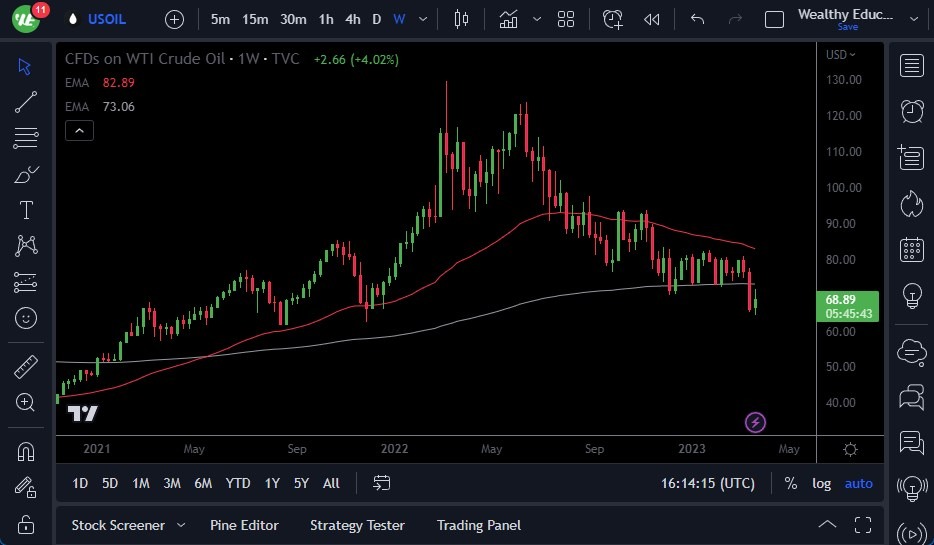
West Texas Intermediate Crude Oil
The West Texas Intermediate crude oil market moved back and forth during the course of the week, rallying all the way to the 200-week EMA before showing signs of exhaustion. If crude oil breaks down below the bottom of the candlestick, then it’s likely that WTI will drop down to the $60 level rather quickly.
This is a market that will mostly likely continue to see a lot of back-and-forth behavior before falling, especially if we continue to see a lot of economic slowdown, which may also drive down demand. However, if crude oil could turn around and break above the $80 level, then the market would enter a new phase. Right now, however, I don’t think we are anywhere near that point. Short-term rallies will likely be sold into.
USD/CAD
The USD/CAD currency pair has similarly moved back and forth during the trading week, as the 1.38 level continued to offer resistance. If the duo can break above that point, then it’s possible that it could go looking to the 1.40 level next, an area that has previously been significant. If the pair can break down below the bottom of the candlestick, it would open up the possibility of a move down to the 1.34 level.
The 50-week EMA sits underneath there, and it looks as though the pair is trying to reach that level. The USD/CAD pair has been forming a huge 'W-shaped' pattern, which typically means that it will eventually break out.

AUD/USD
The AUD/USD pair initially tried to rally during the week, but it continued to see a lot of noise between the 0.67 level and the 0.68 point. Because of this, it does make a bit of sense that the pair pulled back, and now it looks like the pair is ready to go down to the 0.65 level, which is an area that has recently served as support.
However, if the pair were to break down below that level, then it’s likely that it could drop down to the 0.63 level. On the other hand, if it can break above the 0.68 level, then it’s possible that the pair could reach the 0.70 level. Either way, it’s going to be very noisy.

Nasdaq 100
The Nasdaq 100 similarly tried to rally during the week, but it struggled at the same point that it previously could not surpass, the 12,950 level. Ultimately, the fact that it pulled back seems to suggest that traders are not quite ready to push this market to the upside. Therefore, I think it’s likely that the Nasdaq 100 will continue to trade in a sideways market with plenty of volatility, as there is so much economic uncertainty currently.

More By This Author:
USD/JPY Forecast: Continues To Find Buyers On DipsAUD/USD Forecast: Dollar Runs Into Resistance
S&P 500 Forecast: Continues To Look For Direction Ahead Of The FOMC Meeting


Comments
Log in or sign up to join the conversation.