Pairs In Focus This Week - Sunday, July 23

Image Source: Pexels
GBP/USD
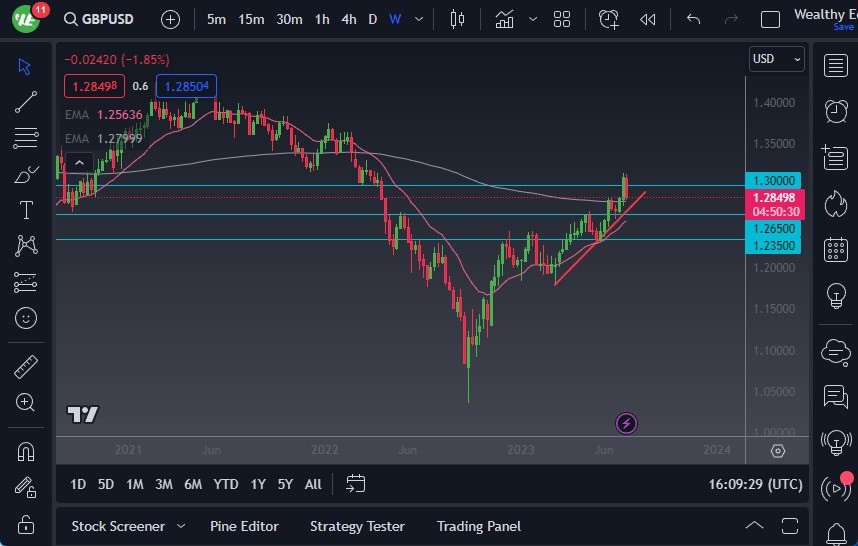
The GBP/USD currency pair pulled back a bit during the course of the trading week, basically wiping out all of the gains from the previous trading period. That being said, it appears to be sitting near the 200-week EMA, and I can see a lot of support underneath.
My suspicion is that the pair may see a little bit of follow-through to the downside, but it will eventually bounce from a trough. However, if we were to see a break through the 1.2650 level, the British pound would continue to go much lower.
EUR/USD
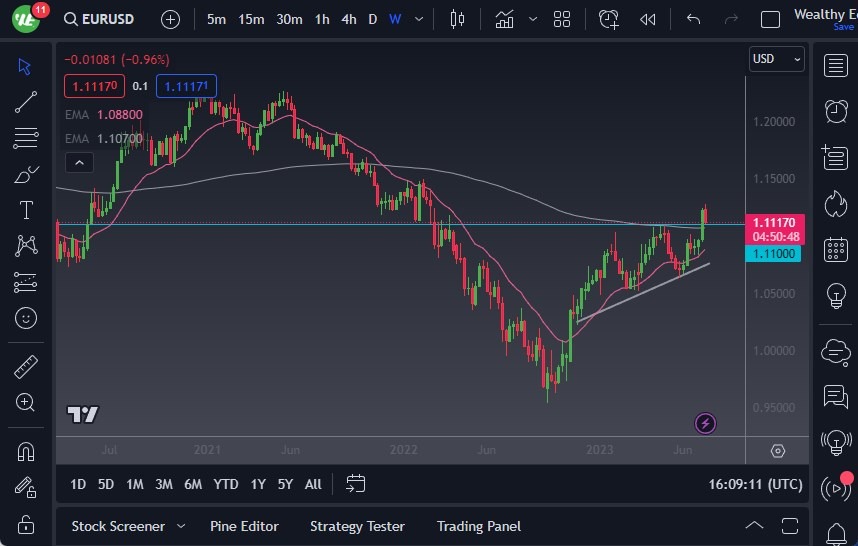
The EUR/USD currency pair pulled back during trading over the last several days, reaching down to the 1.11 level. The 200-week EMA appears to be set just underneath, and therefore it’s likely that buyers may try to come back into this picture. After all, one could make an argument for an ascending triangle that we are testing the top of. Therefore, it’s likely to see some support.
However, if the pair were to turn around and break down below the 1.08 level, then it could start to fall apart. Nonetheless, I think it’s probably likely that this market will come to experience more of a “buy on the dip” attitude.
Silver
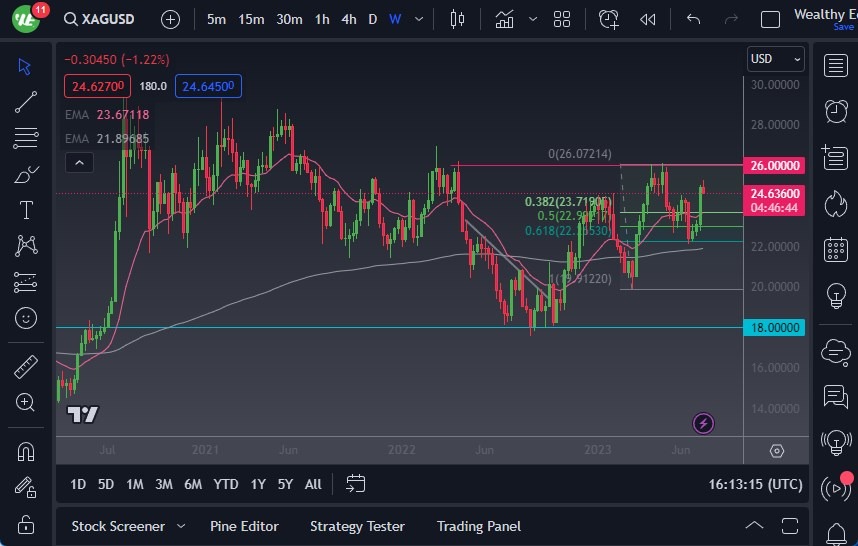
Silver initially tried to rally during the course of Friday's trading session, showing signs of bullish pressure. However, it then turned around to show signs of negativity and exhaustion. That being said, the previous week was extraordinarily bullish, so I think a pullback would make quite a bit of sense.
Nonetheless, I do think that value will show up toward the end of the week, perhaps near the $24 level. Alternatively, if the metal could break above the top of the candlestick for the past week, this would open up the possibility of a move to the $26 level.
USD/CAD
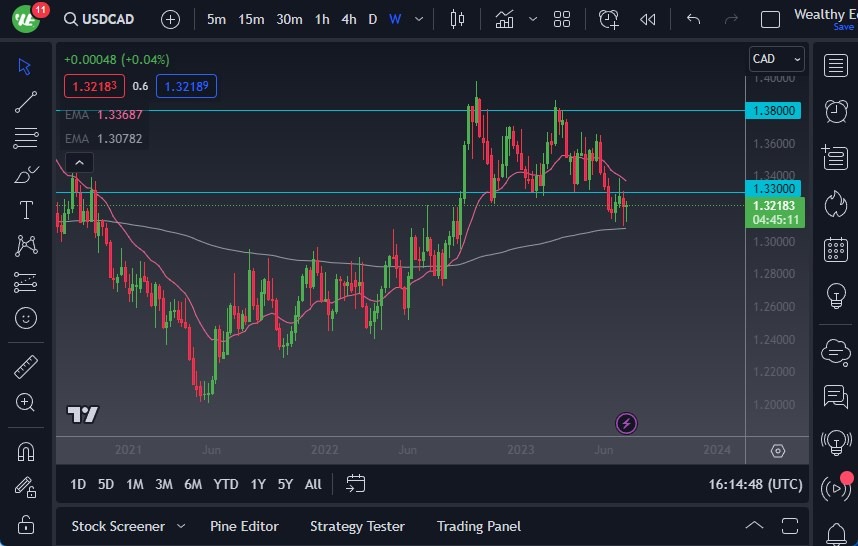
The USD/CAD pair initially fell during the trading week, but it has been seen hanging around above the 200-week EMA. If it were to break above the top of the candlestick, then it’s likely that it could go above the 1.33 level, and perhaps past the 1.34 level. In general, this currency pair has been trading in a tight range, and therefore I think more consolidation may be on the way.
AUD/JPY
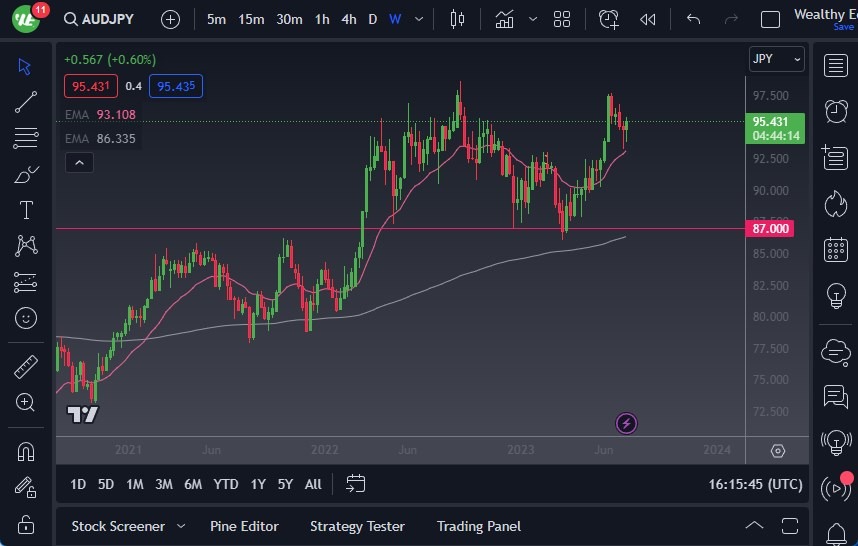
The AUD/JPY currency pair pulled back a little bit during the course of the week, only to turn around and show signs of life again. At this point, if it were to break above the top of the candlestick, then it’s possible that it could go looking toward the JPY97.50 level. Underneath, the JPY92.50 level would offer support, right along with the 50-week EMA.
All things being equal, it is likely that this market will see a lot of buying pressure eventually, due to the fact that the Bank of Japan remains ultra-loose with its monetary policy, while the Australian dollar continues to see the Reserve Bank of Australia act hawkish.
NZD/USD
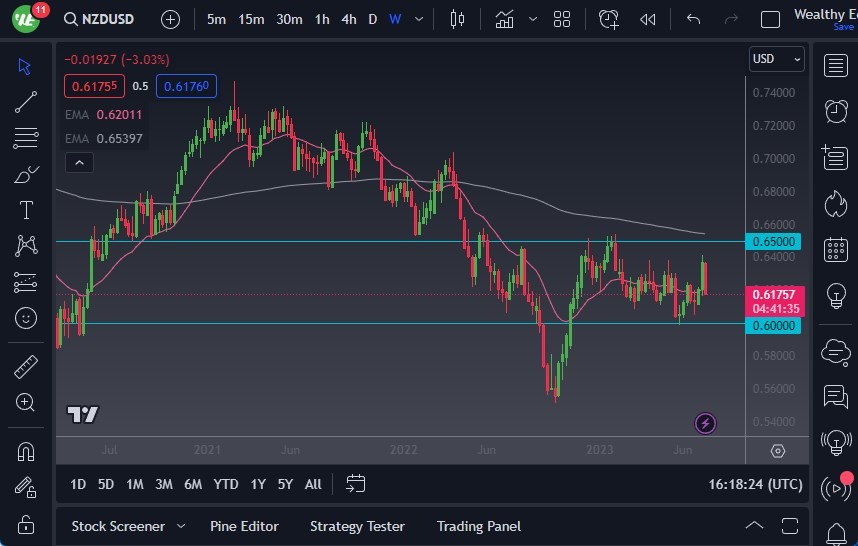
The NZD/USD pair was hammered during the course of the week, breaking down to the 50-week EMA. At this point, it’s very possible that the New Zealand dollar could go looking to the 0.60 level, which is a psychologically important figure.
If we see a break down below there, the pair could then go down to the 0.58 level. On the other hand, if the 0.60 level gets supported, then it could bounce back toward the 0.62 level, possibly even the 0.64 level. Keep in mind that the New Zealand dollar is highly sensitive to global growth.
Copper
I don’t normally cover copper, but quite frankly it’s an important commodity. While many may not trade copper, it is something worth paying attention to as the market tends to show us where economic growth may or may not be heading.
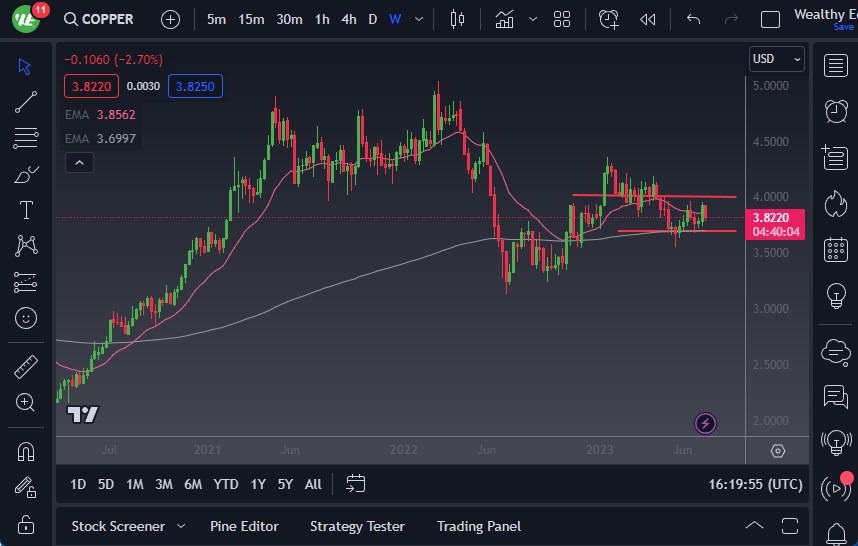
The $4.00 level above continues to offer resistance, right along with the 3.75 level underneath. If copper breaks down below the 200-week EMA, which is basically at the bottom of that range, then it would likely go down to the $3.50 level. On the other hand, if it turns around breaks above the $4.00 level, that would be very bullish and could open up a move to the $4.25 level.
Perhaps more importantly, such a move could signal that markets in general would be “risk-on.”
Nasdaq 100
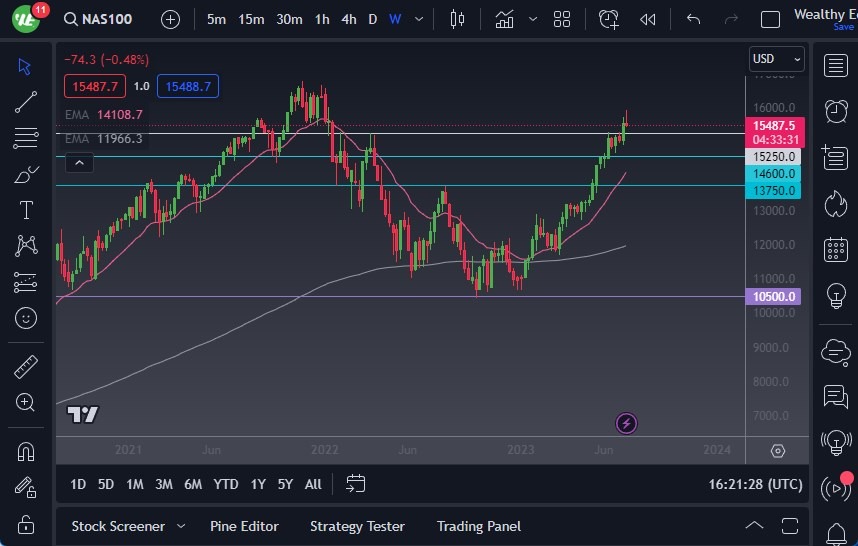
The Nasdaq 100 initially tried to rally during the course of the week, but it gave back quite a bit of the gains to turn around and form a shooting star. It has been digging into an area that previously was rather noisy, so I do think that the Nasdaq 100 may experience a bit of a pullback here.
That being said, I am not a seller of the Nasdaq 100 due to the fact that the market has quite a bit of support underneath. The 15,250 level underneath appears to be a short-term floor, followed by the crucial 14,500 level.
More By This Author:
Silver Forecast: Finally Seeing Gravity As US Dollar Strengthens
EUR/USD Forecast: Continues To See Upward Momentum Despite Slight Pullback
Pairs In Focus This Week - Sunday, July 16
Disclosure: DailyForex will not be held liable for any loss or damage resulting from reliance on the information contained within this website including market news, analysis, trading signals ...
more


