Pairs In Focus This Week - Sunday, Dec. 3

Image Source: Pixabay
FTSE 100
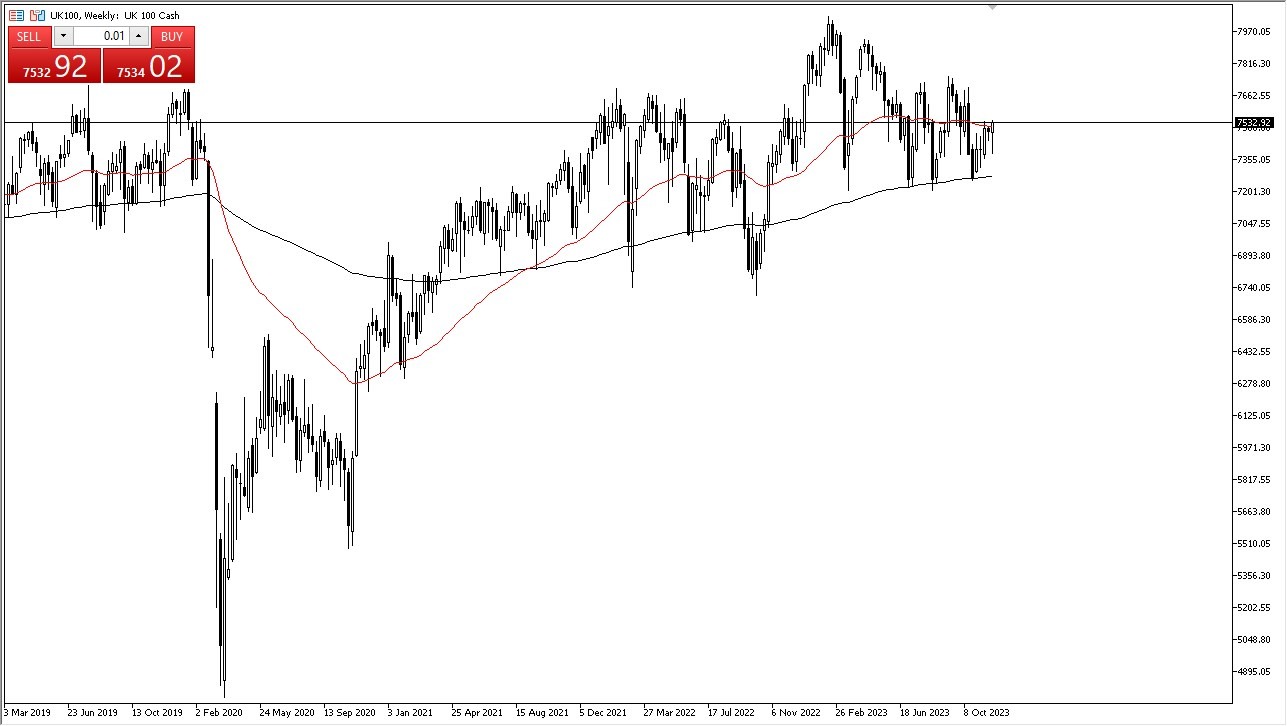
The FTSE 100 initially pulled back during the course of the trading week, but it found enough support near the 7360 level to turn things around and show signs of life. The weekly candlestick appears to have formed a hammer, and this suggests a continuation of higher movement, possibly even to the 7700 level above.
If it could break above the 7700 level, then it could likely go reaching to the 7900 level given enough time. It’s also worth noting that the 200-week EMA underneath has offered significant support as well.
(Click on image to enlarge)
DAX
The German DAX rallied significantly during the trading week, closing just below the recent highs and looking set to go much higher. That being said, it appears to be a little overextended, so it may not be surprising to see some kind of pullback. A pullback would offer some value that many would be willing to take advantage of, with the EUR15,500 level being a major support level, right along with the 50-week EMA.

(Click on image to enlarge)
USD/CHF
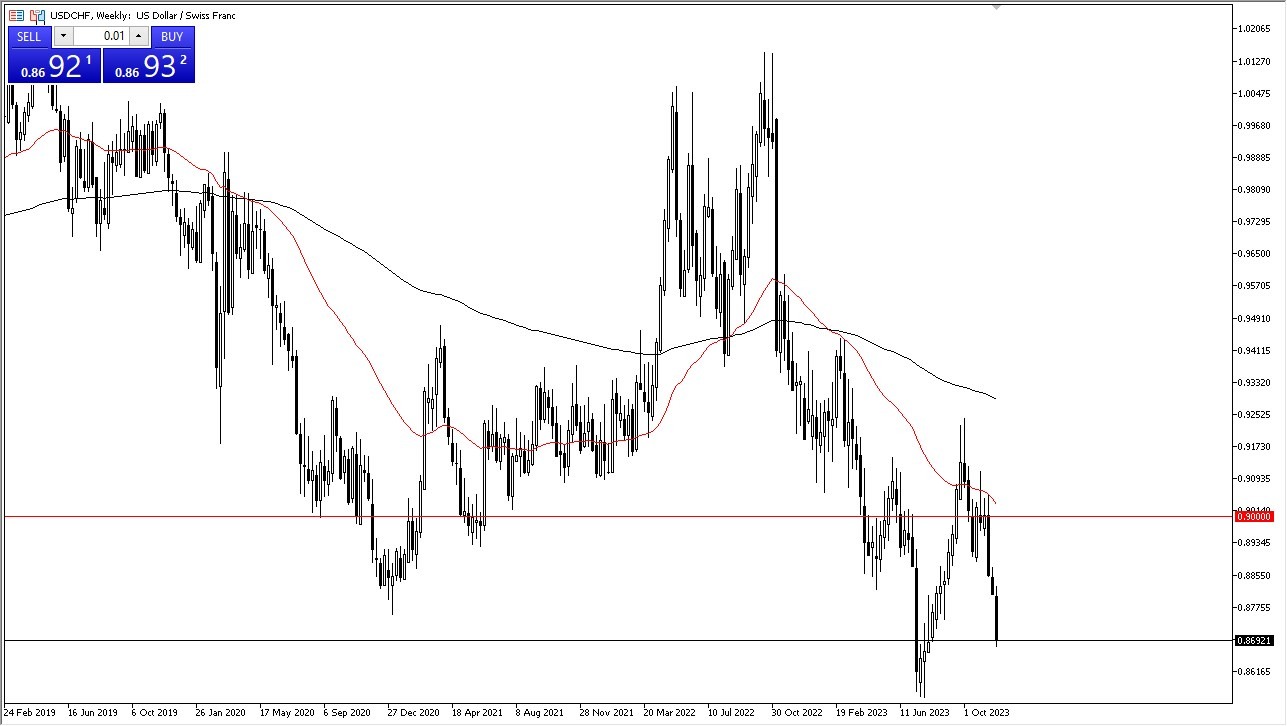
The US dollar fell rather significantly during the course of the trading week against almost everything, and the Swiss franc was no exception. The market has tested the 0.87 level, and it did break down below there just a little bit.
The market will likely see plenty of negativity, especially if yields in the United States continue to face downward pressure. If the bond market does continue to see this downward pressure, then I think the Swiss franc will benefit. That being said, it may be beneficial to look for a short-term bounce that one can start fading on the first signs of exhaustion.
(Click on image to enlarge)
EUR/USD
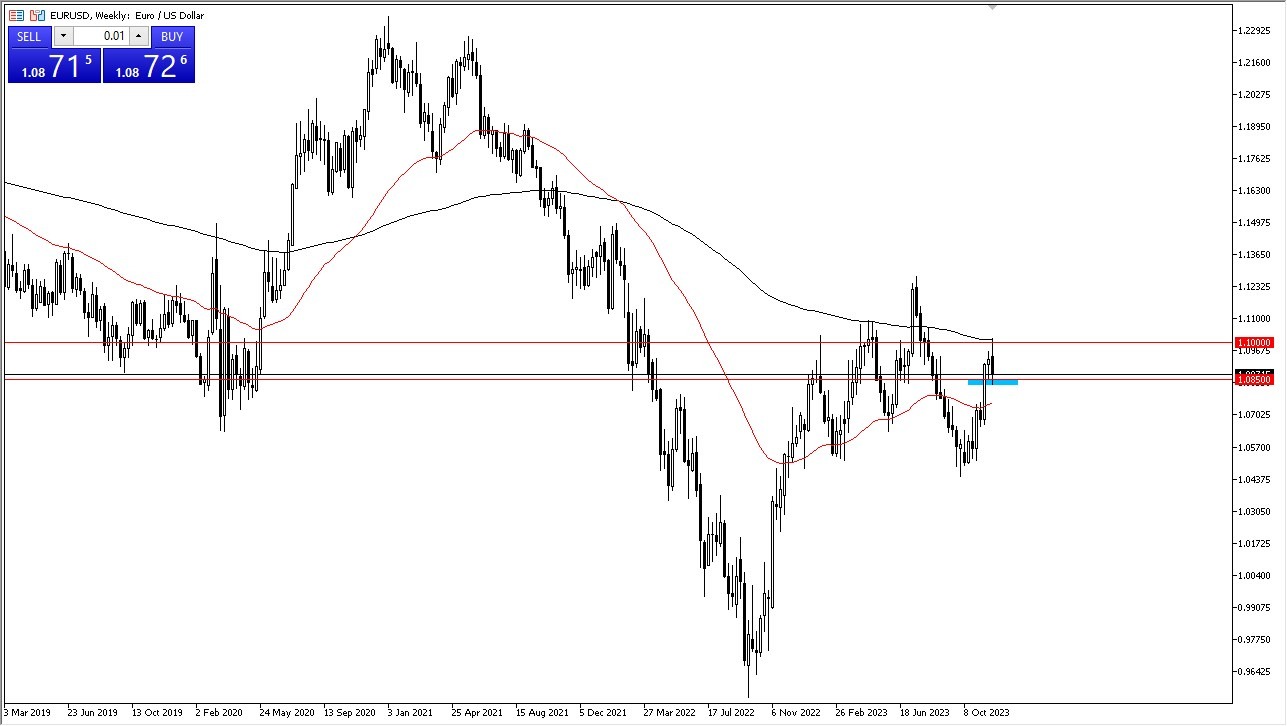
The euro initially tried to rally during the course of the trading week, but it ran into the 200-week EMA near the 1.10 level as a major barrier. By pulling back from that level, it has become clear that there will continue to be a lot of volatility in this space.
Underneath, the 1.0850 mark is a significant support level that may continue to see a large amount of trading. If we were to see a break down below the bottom of the candlestick, then it’s possible that it could drive down to the 50-week EMA. On the other hand, a break above the candlestick for the week would open up the possibility of a move to the 1.1250 level.
(Click on image to enlarge)
Gold
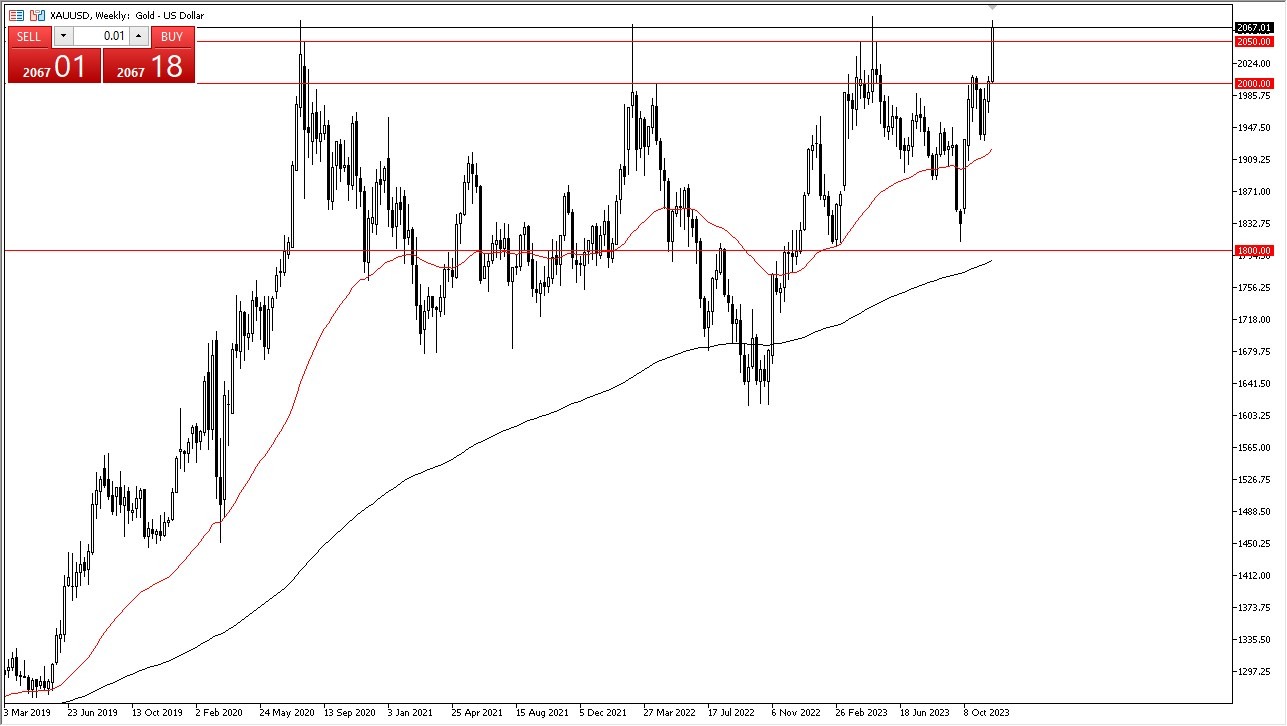
Gold markets exploded to the upside during the trading week, as the yellow metal appeared to be closing near the recent all-time highs. It’s worth noting that this area has previously acted as a major barrier, so even though it looks rather bullish, it would not be surprising to see this market drop.
If we were to see a drop from here, the $2000 level would be an area to keep an eye on. I would anticipate that a lot of value hunters would come back into the market in order to take advantage of the move, but if we were to see a break down below that point, then it’s possible that it could drop down to the 50-week EMA. Ultimately, if we see a break above the $2080 level, then gold will take off again.
(Click on image to enlarge)
GBP/USD
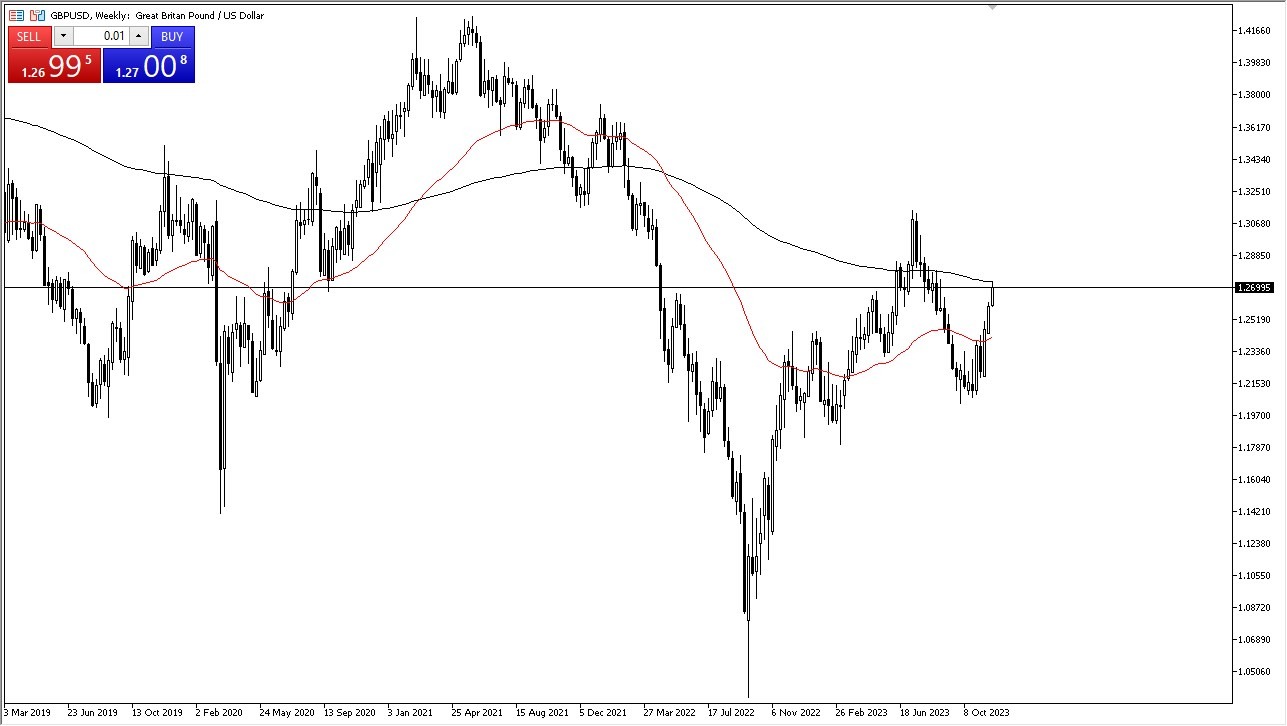
The British pound rallied during the week, testing the 200-week EMA. A break above the 200-week EMA would suggest that the pound could continue to rally. At that point, the British pound could even go looking to the 1.30 level.
(Click on image to enlarge)
USD/CAD
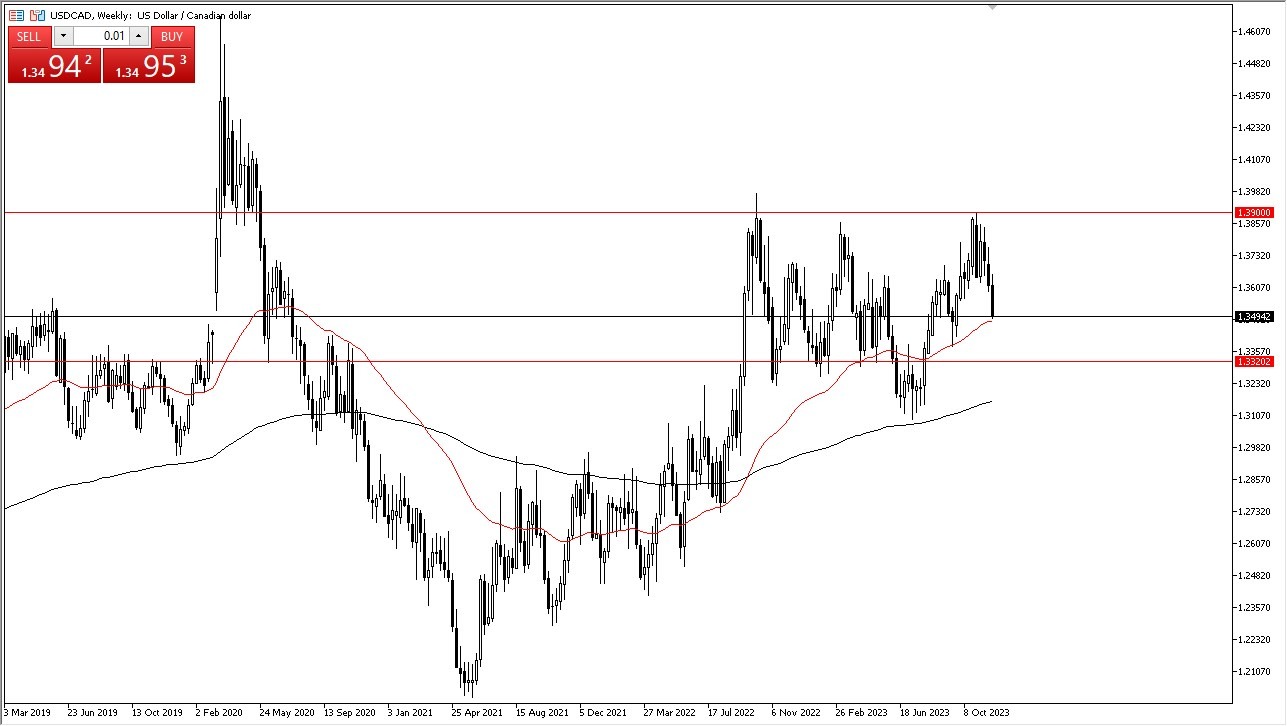
The US dollar initially tried to rally a bit during the trading week, but it then fell down to the 1.35 level. The 50-week EMA underneath may offer support, but I think it's likely to drop down to the 1.3320 level, an area that has been important previously.
The size of the candlestick seems to suggest that there is plenty of momentum to be seen, but it is starting to get oversold on the daily chart. Therefore, I think that any rally at this point may offer an opportunity to start buying Canadian dollars again.
(Click on image to enlarge)
Dow Jones 30
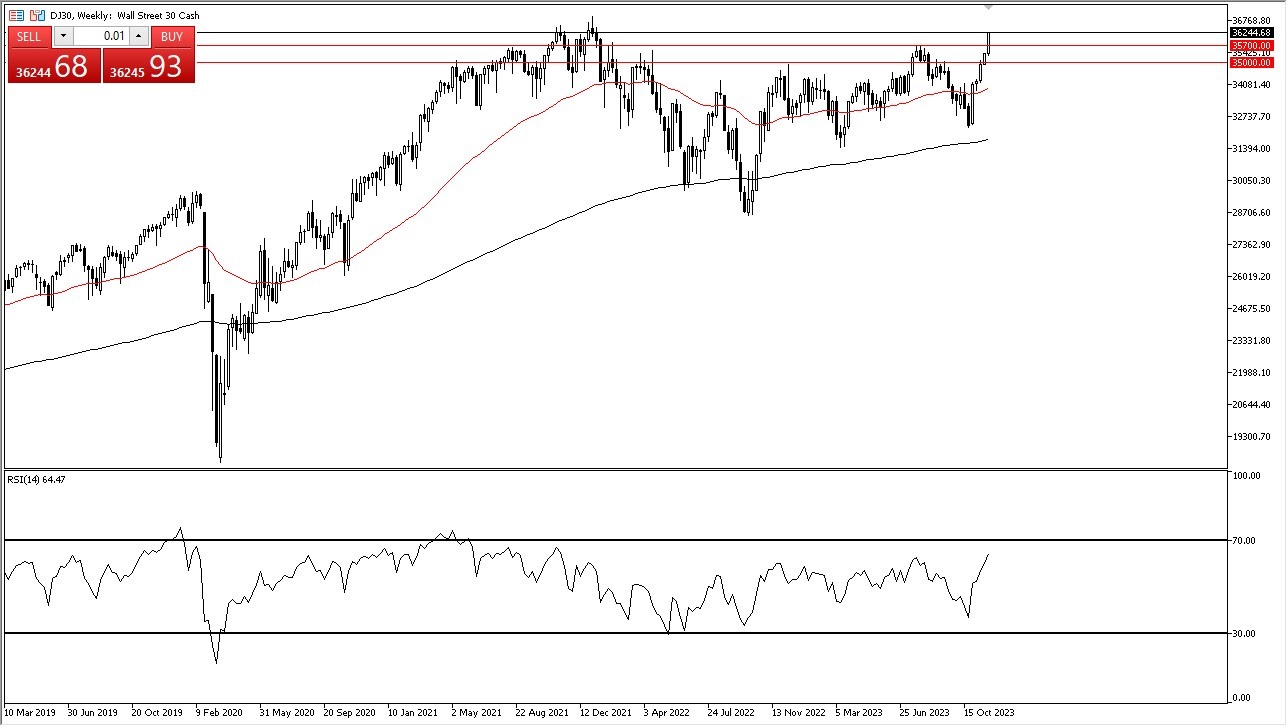
The Dow Jones 30 took off to the upside during the course of the week, as it hovered well above the 36,000 level. A short-term pullback may offer a buying opportunity in a market that has been very bullish for some time. The 35,700 level underneath is significantly supportive from what I can tell. Additionally, we are in that time of the year where many rush into the stock market to kick off the so-called “Santa Claus rally.”
(Click on image to enlarge)
More By This Author:
USD/CHF Signal: Has Wild Ride against Swiss FrancSilver Forecast: Dances Around Big Figure
BTC/USD Forecast: Look Hesitant
Disclosure: DailyForex will not be held liable for any loss or damage resulting from reliance on the information contained within this website including market news, analysis, trading signals ...
more


