Pairs In Focus This Week - Monday, Jan. 1

Image Source: Pexels
S&P 500
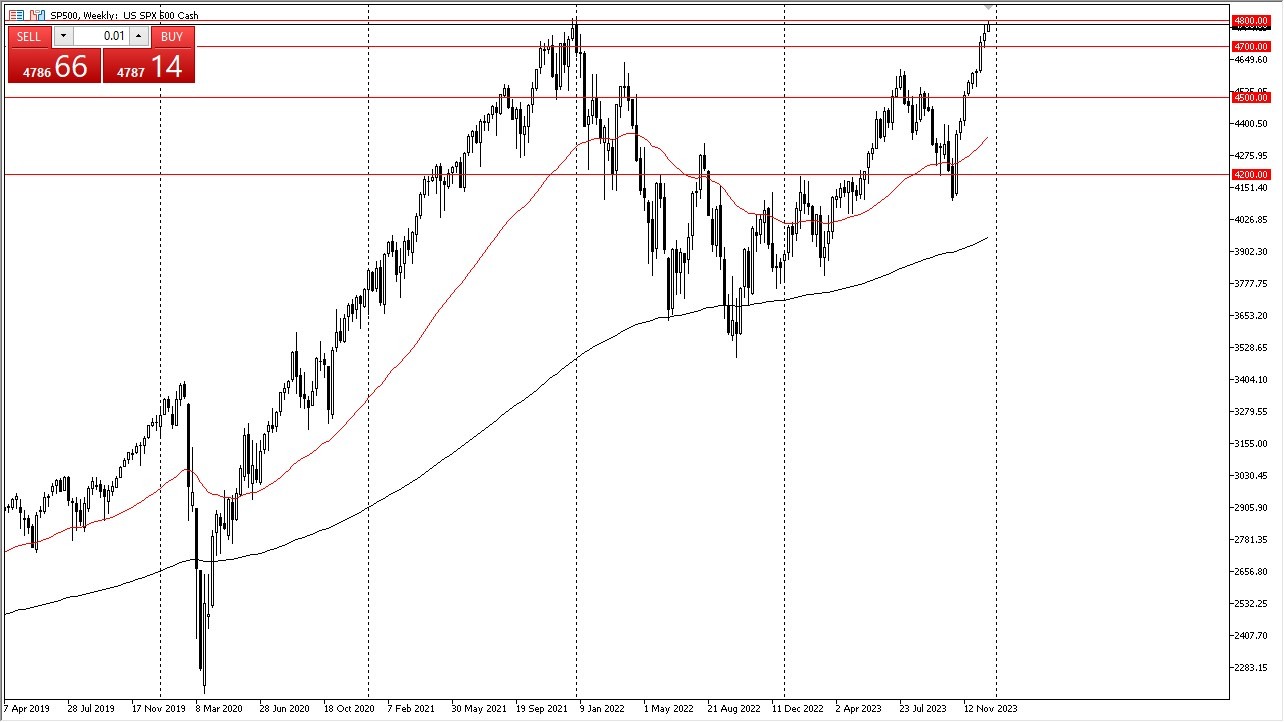
The S&P 500 rallied yet again during the last week of the year, but it seemed to struggle at the previous high. I think we will see a little bit of a pullback, but buyers will likely appear underneath, especially near the 4700 level.
Breaking down below that level could open up a move down to the 4500 level, but I don’t know if the index would correct that deeply. Regardless, a pullback is probably necessary.
(Click on image to enlarge)
WTI Crude Oil
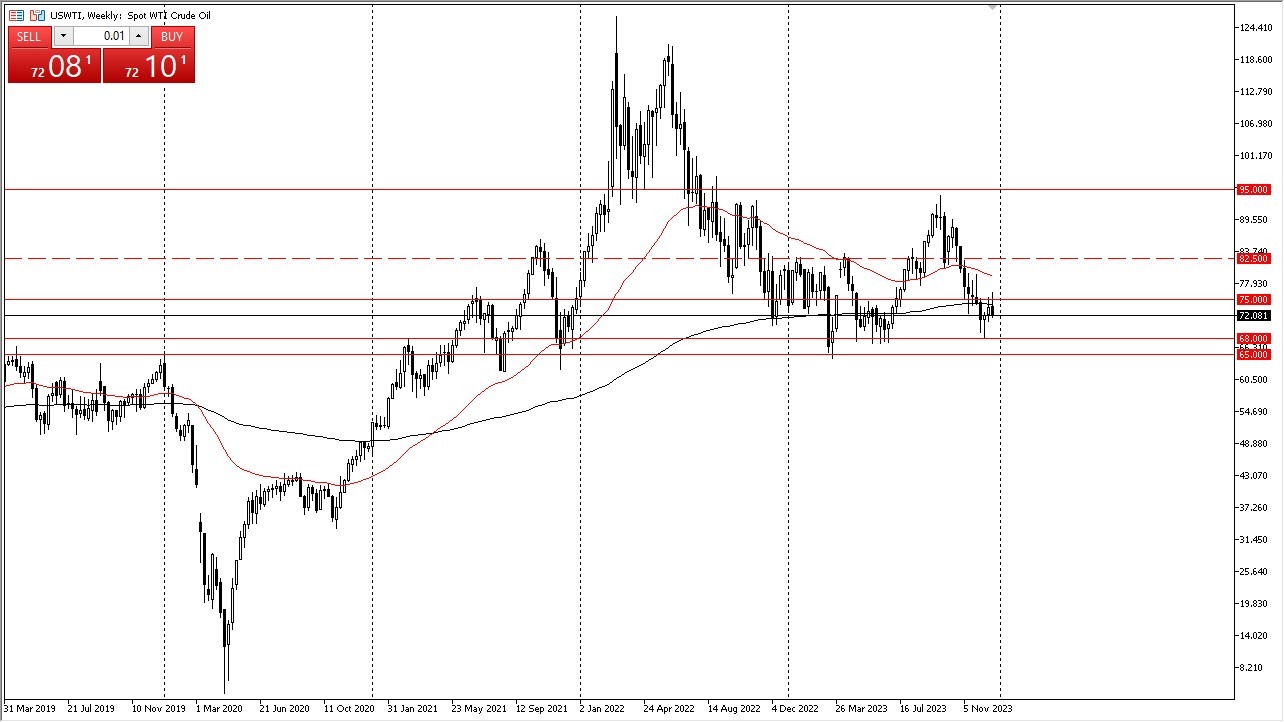
Crude oil initially tried to rally during the week, but it found the area above the $75 level to be a bit too much to overcome. If it can break above the top of the candlestick, such a move would be a very bullish sign. It could also send the market looking toward the 50-week EMA, which sits just below the $80 level.
Underneath, if we were to see a break down below the bottom of the candlestick, crude oil could then retest the $70 level, and then eventually the $68 level which is a major bottom in the market.
(Click on image to enlarge)
AUD/USD
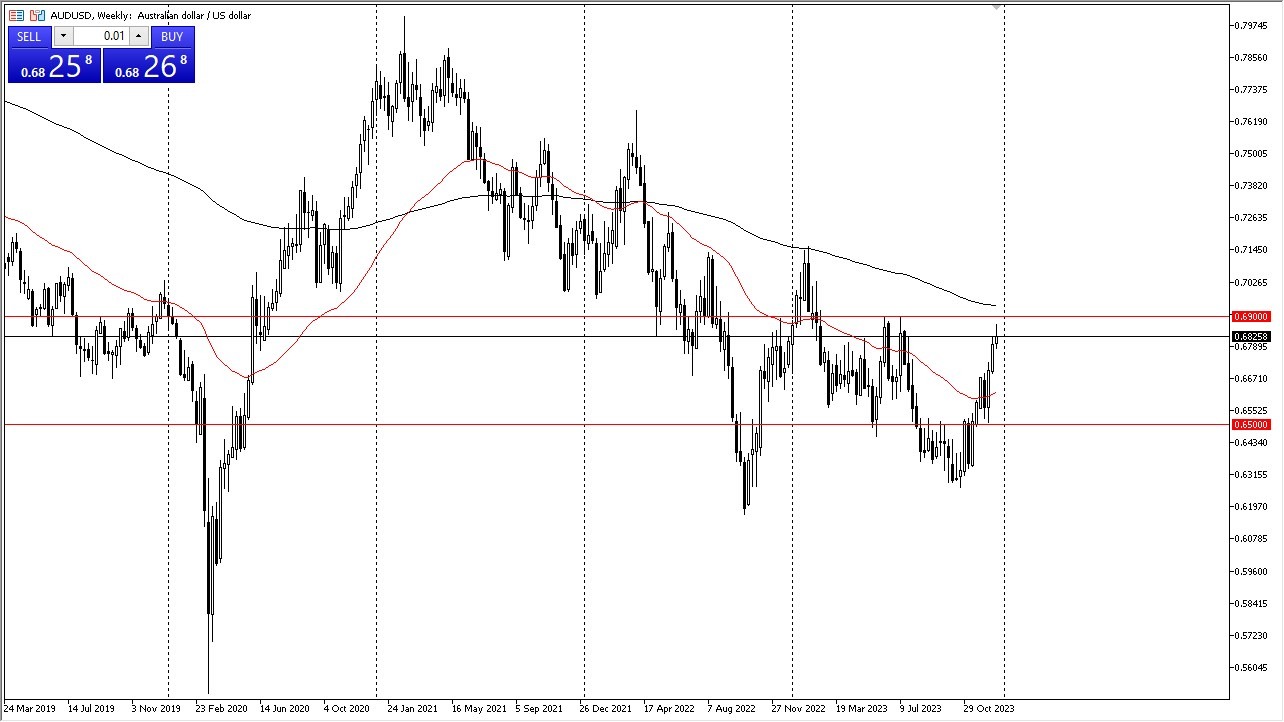
The Australian dollar initially tried to rally during the week, but it gave back its gains near the 0.69 level. The 0.69 level is an area that has previously been very resistant, and we have the 200-week EMA in the picture as well, so I think this all may line up quite nicely for a pullback.
At this point, if we were to see a break down below the bottom of the candlestick, the Australian dollar could very well drop down to the 0.6650 level. On the other hand, if it were to turn around and take out the 0.69 level on a weekly close, then it could open up a move to the 0.7150 level.
(Click on image to enlarge)
BTC/USD
Bitcoin pulled back just a bit during the trading week, only to turn around and bounce a bit. The $40,000 level appears to be a major support level, and therefore I think it will see some sideways consolidation. It seems obvious to me that Bitcoin is in a bullish phase over the longer-term at the moment.
Working off the excess froth makes a certain amount of sense, but if we were to see Bitcoin break above the top of the last couple of candlesticks, then it could open up the possibility of a move to the $47,500 level, an area that has been major resistance previously.

(Click on image to enlarge)
Gold
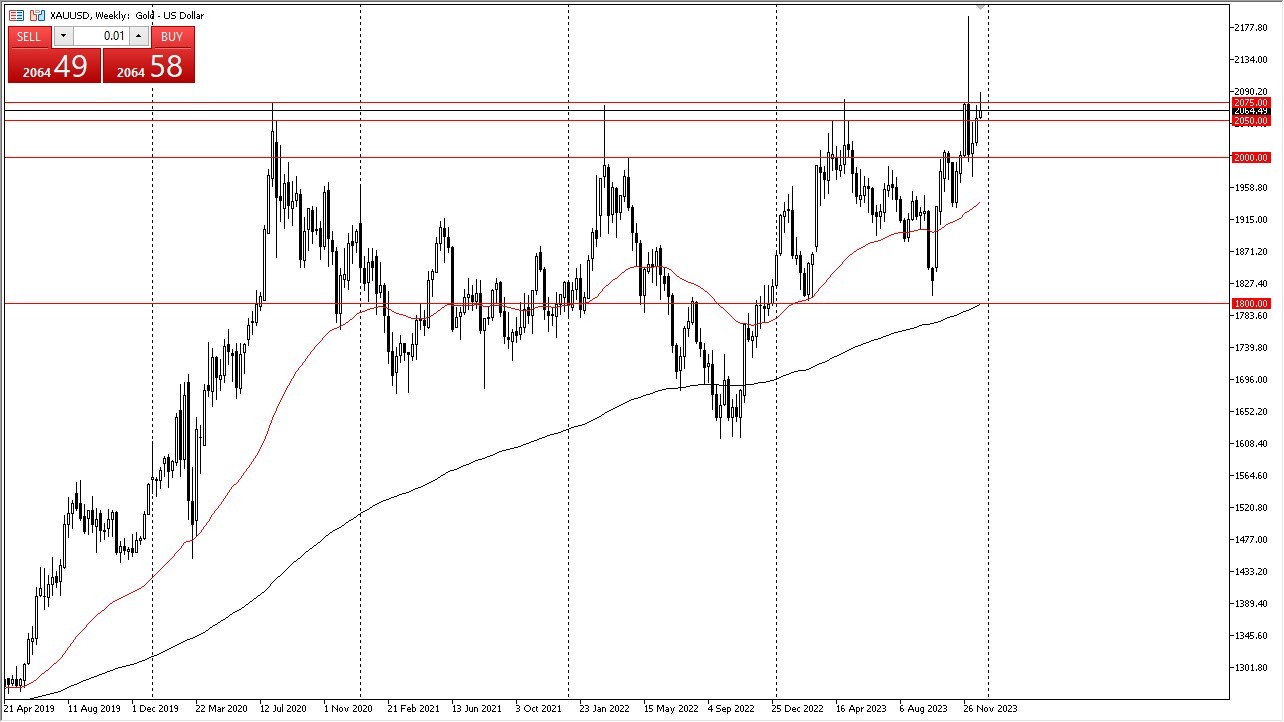
Gold rallied a bit during the week, but the yellow metal gave back most of the gains as it broke above the $2075 level, only to turn around to start falling. This is a shooting star formation, which seems to suggest that we are going to see a lot of resistance just above. Thus, if we were to see a break down below the $2050 level, then it’s likely that we could see it drop down to the $2000 level.
If gold can break above the top the candlestick for the week, then it could go looking to the $2125 level next. Pay close attention to the interest rate markets in America, because if the 10-year rates start to drop, that could help gold.
(Click on image to enlarge)
Nasdaq 100
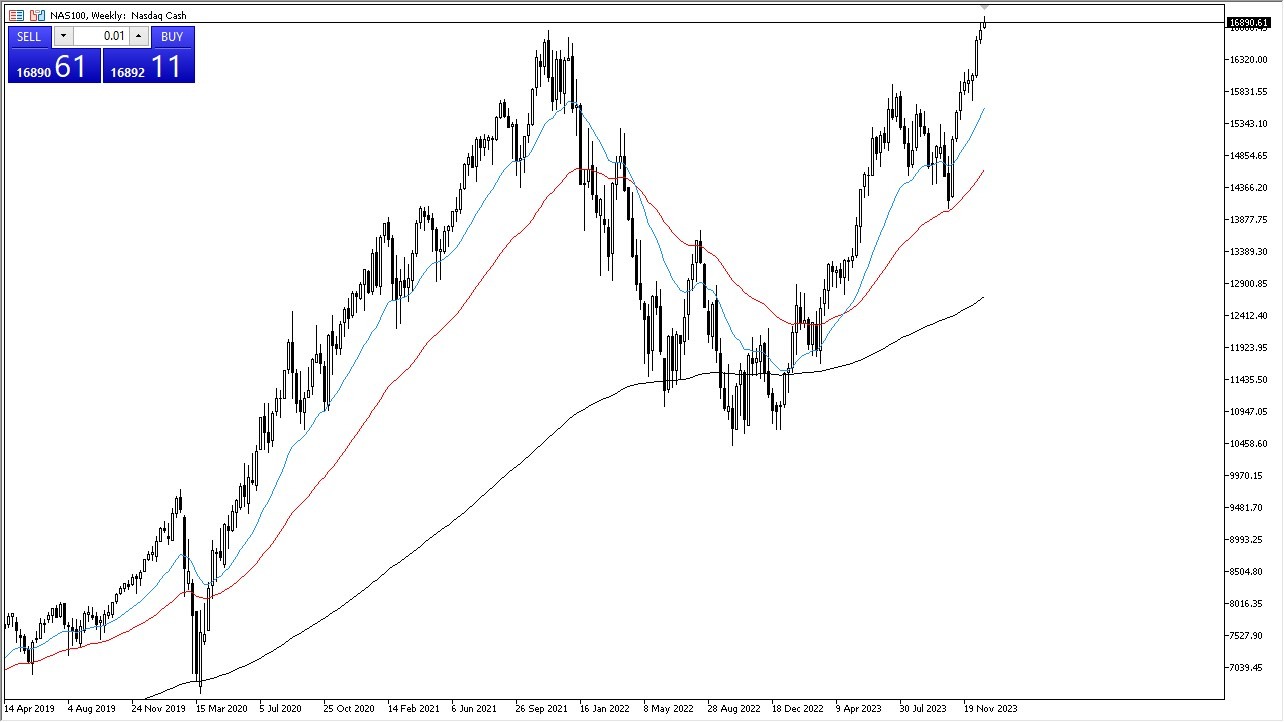
The Nasdaq 100 rallied again during the trading week, but it did give back some of those gains. This is a market that appears to be overextended, so I expect to see a significant pullback.
The smartest move that you can probably make in this market is simply to let it do its thing, and then turn around and start buying at the first signs of a significant stabilization and bounce. I would be especially interested in the 16,000 level, but the buyers have been very aggressive recently. Chasing the trade up here could be very dangerous.
(Click on image to enlarge)
GBP/USD
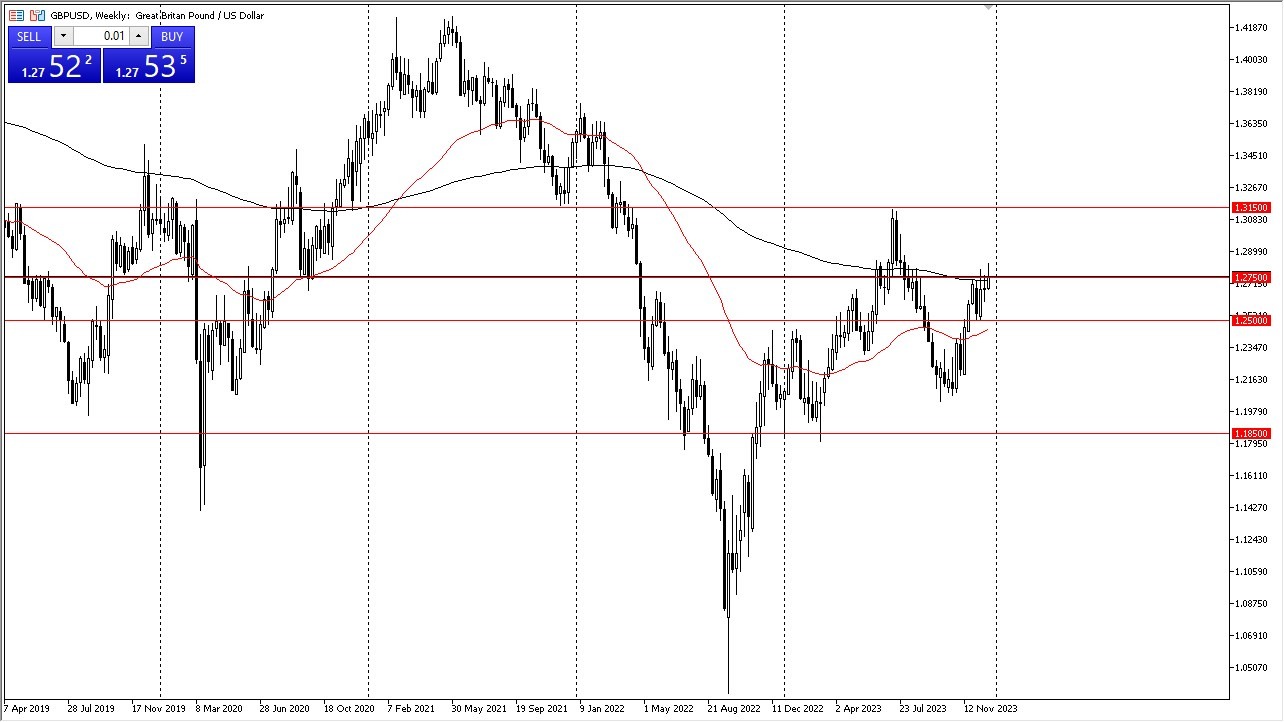
The British pound broke above the 1.2750 level during the week, but it gave back the gains above there to show signs of hesitation. This is an area that has been resistant before, so it’s not a huge surprise to see a struggle here now.
Underneath, the 1.25 level appears to be offering significant support, and it is right around the 200-week EMA, which could cause even more noise. If it can break above the top of the weekly candlestick, then the British pound could go looking to the 1.3150 level.
(Click on image to enlarge)
EUR/USD
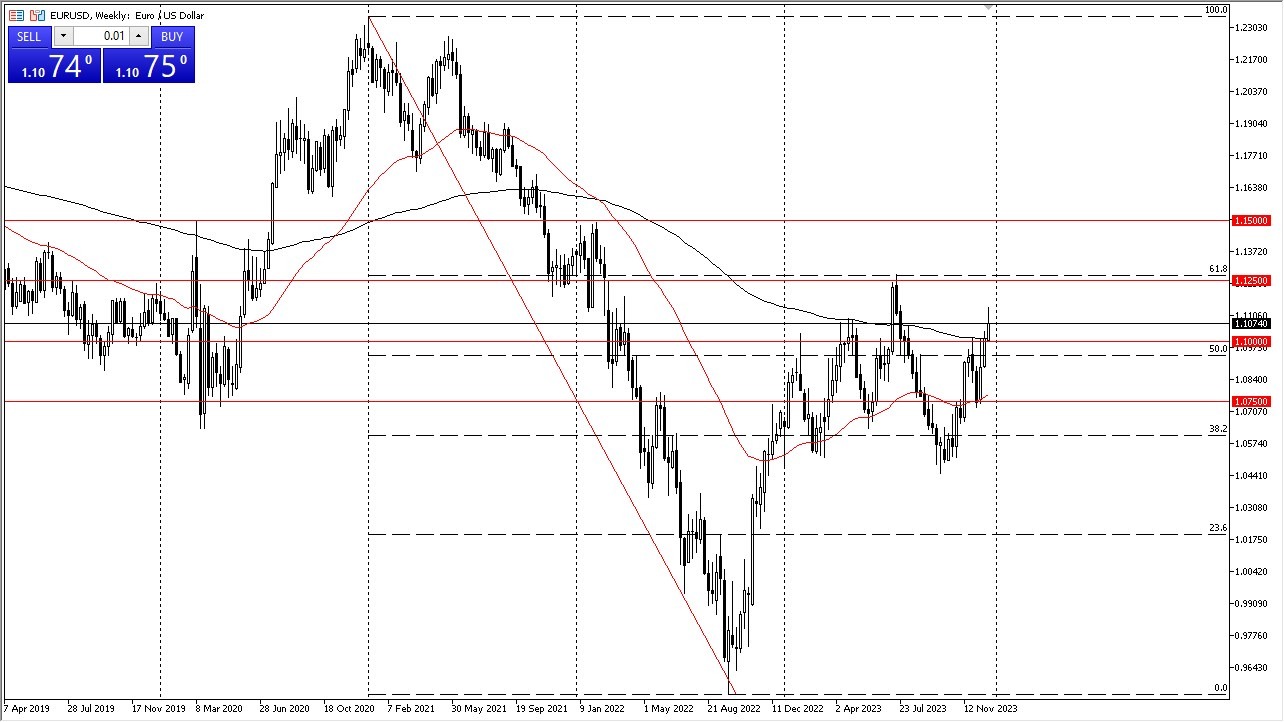
The euro rallied during the bulk of the week, as it tried to take out the 1.11 level above. Underneath, the 1.10 level is a major support level, and I think that the euro will eventually try to target the 1.1250 level. The 1.1250 level is the 61.8% Fibonacci level, and an area that has been very difficult to overcome in the past.
(Click on image to enlarge)
More By This Author:
S&P 500 Forecast: January 2024Gold Forecast: January 2024
Nasdaq 100 Forecast: January 2024
Disclosure: DailyForex will not be held liable for any loss or damage resulting from reliance on the information contained within this website including market news, analysis, trading signals ...
more


