Pairs In Focus - Sunday, July 28

Image Source: Pixabay
Gold
(Click on image to enlarge)
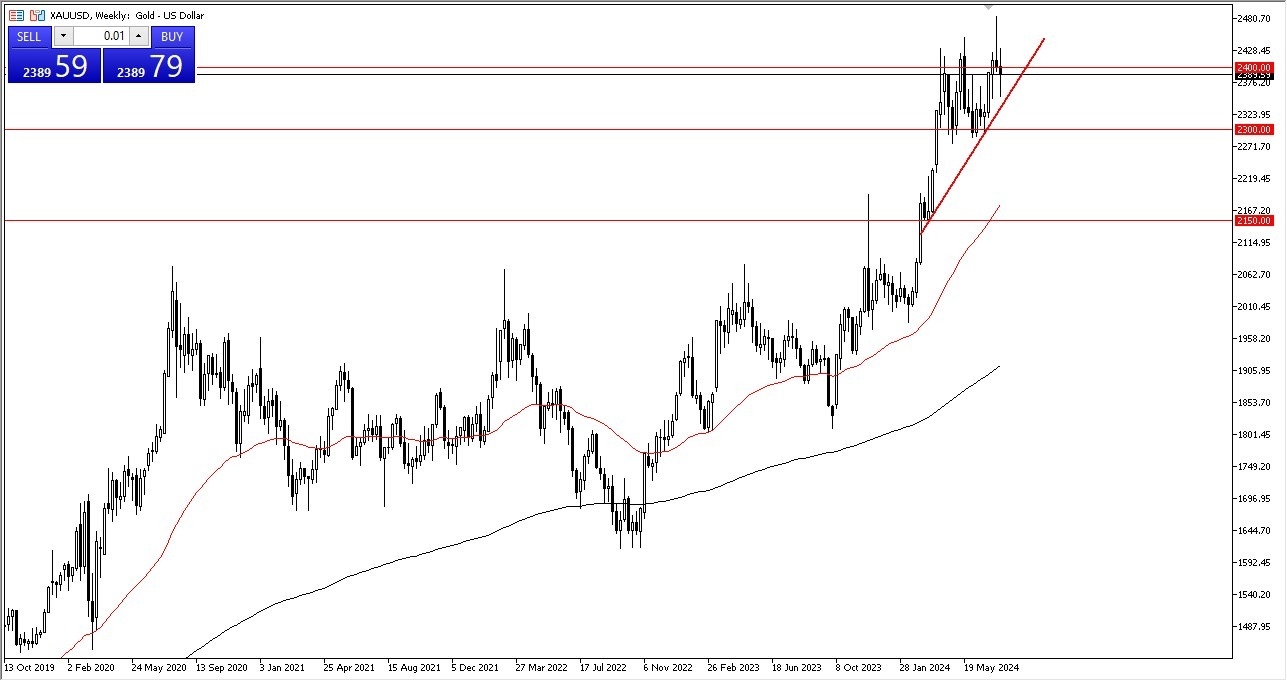
Gold markets were very noisy over this past week, but things may turn around soon. The candlestick will likely end up being a hammer, and this tells me that there are buyers underneath, and that the uptrend will try to reassert itself. With this being the case, I suspect that this is a market that will go higher over the longer-term. There are plenty of geopolitical issues out there to keep the gold market bullish, as well as falling rates.
WTI Crude Oil
(Click on image to enlarge)
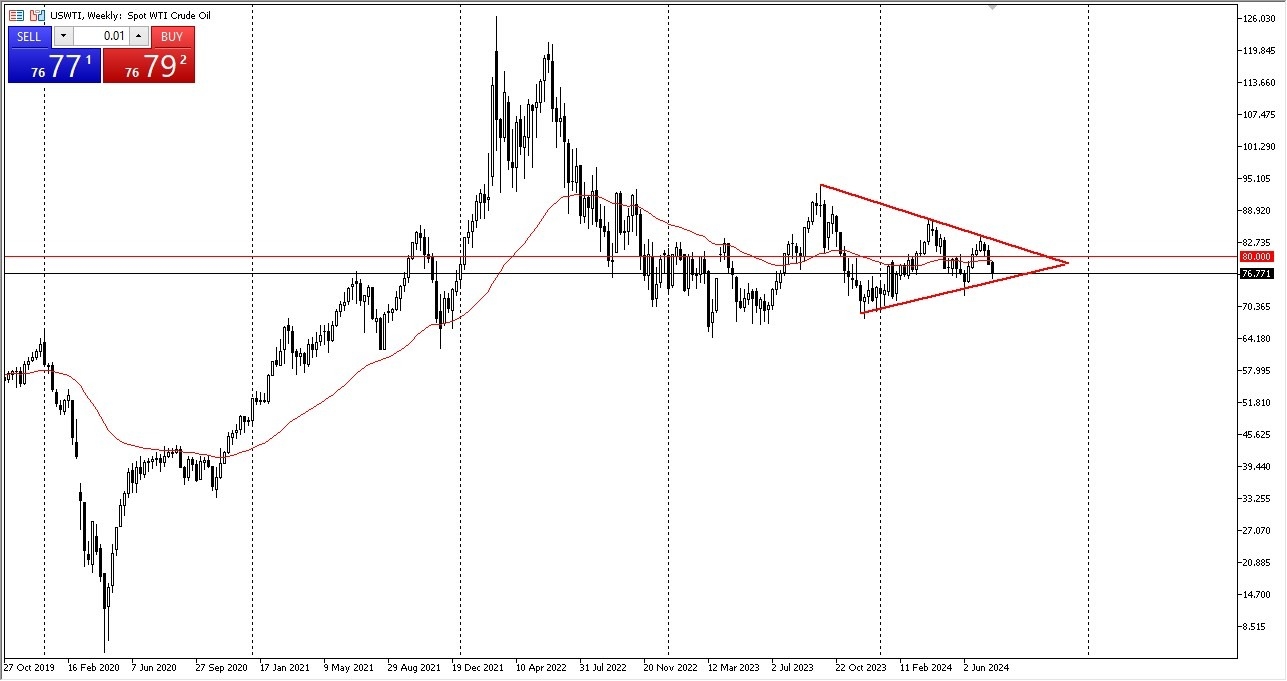
The crude oil space fell during the course of the week, and it looks like we are going to continue to see a lot of noisy behavior. The market will likely see a lot of support just below its recent close, and I think crude oil will remain in a huge range going forward. As things stand right now, it appears that crude oil has been testing the uptrend line of a major symmetrical triangle, and therefore it wouldn’t surprise me at all to see a little bit of a recovery in price.
S&P 500
(Click on image to enlarge)
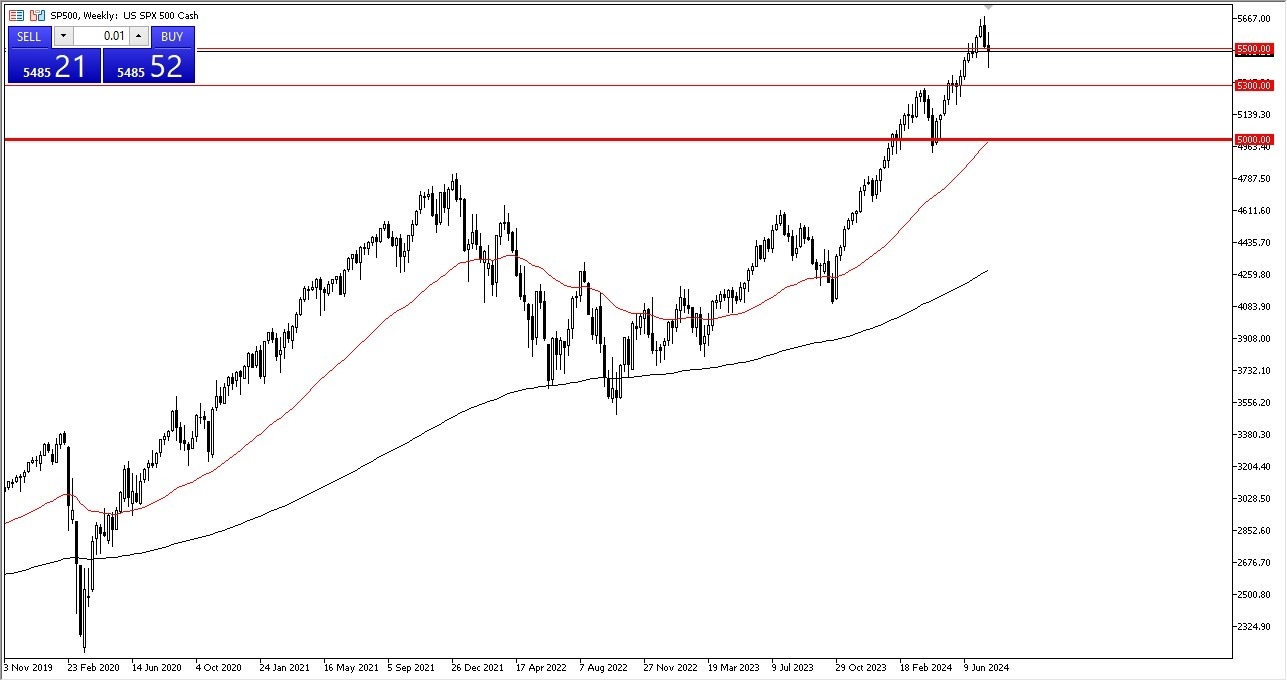
The S&P 500 fluctuated all over the place during the week, but I would be remiss if I didn’t point out the fact that this movement ended up forming a bit of a negative candlestick that has recovered. In other words, it certainly looks like the stock market is trying to recover. You can see this across the equities markets, and therefore I think it’s probably only a matter of time before it becomes viable to start going long yet again.
Breaking above the 5500 level should open up the possibility of this market testing the highs again. If it breaks down, then I see massive support at the 5300 level.
AUD/USD
(Click on image to enlarge)
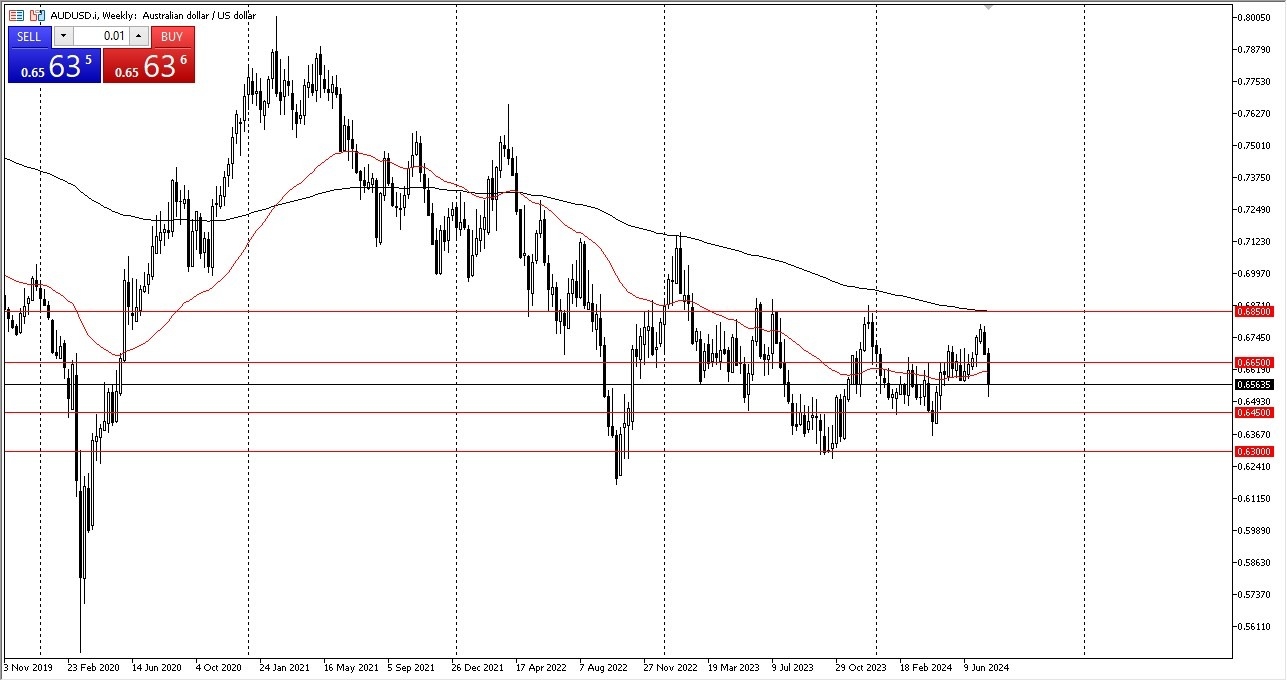
The Australian dollar plunged during the course of the trading week, as it broke down to the 0.6550 level. The market is going to go looking to the 0.6450 level if we were to see the Aussie fall. However, if we were to see it turn around and rally, I think the 0.6650 level above would be the figure to pay attention to.
In general, the AUD/USD market is one that I think will continue to see a lot of noisy behavior. Perhaps it could even be described as a sideways market, with the 0.6850 level being the ceiling and the 0.63 level being the floor.
DAX
(Click on image to enlarge)
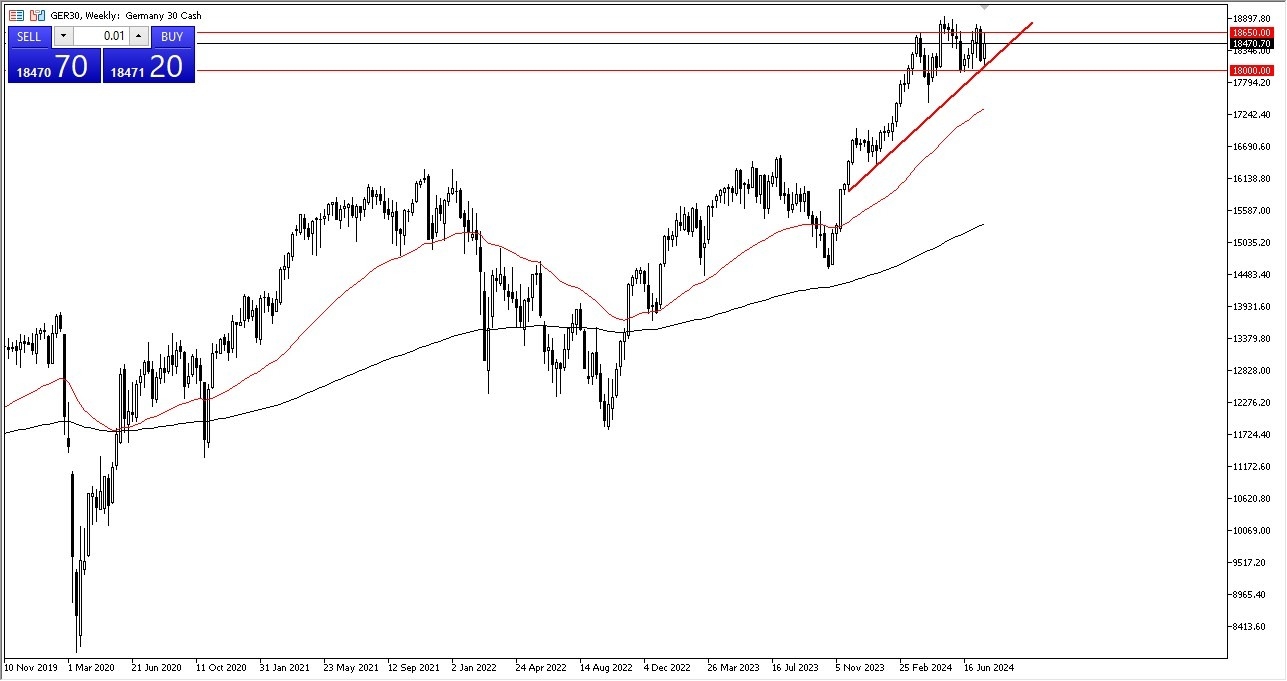
The German index was very bullish during the course of the week, as it slammed into the EUR18,650 level. It really sold off at one point, and the index has since recovered quite nicely from a major trend line.
In general, this is a market that I think will continue to see a lot of noise. If the index can break above the EUR19,000 level, then I think more traders would jump into this market and take advantage of the overall uptrend. At that point, I would anticipate seeing the DAX reach toward the EUR20,000 level.
EUR/GBP
(Click on image to enlarge)
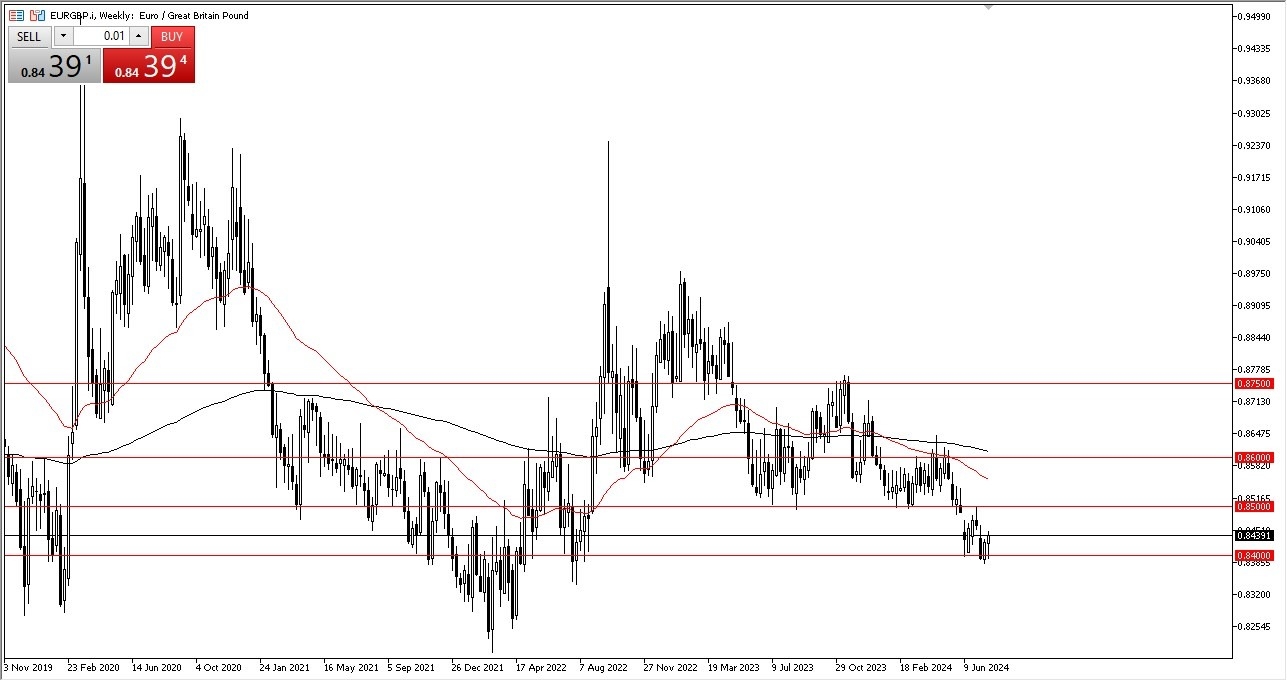
The euro initially fell during the course of the trading week to test the 0.84 level. The market then turned around to show signs of life, and it ended up looking very bullish. The market ended up forming a hammer for the week at an extraordinarily low level, and therefore I think the euro may see some real value.
If we were to see it break above the 0.85 level, such a move would obviously be a very bullish turn of events, and it could allow even more people to jump into the market. On the other hand, if it broke down below the 0.84 level, then the market would likely go looking to the 0.83 level below.
GBP/JPY
(Click on image to enlarge)
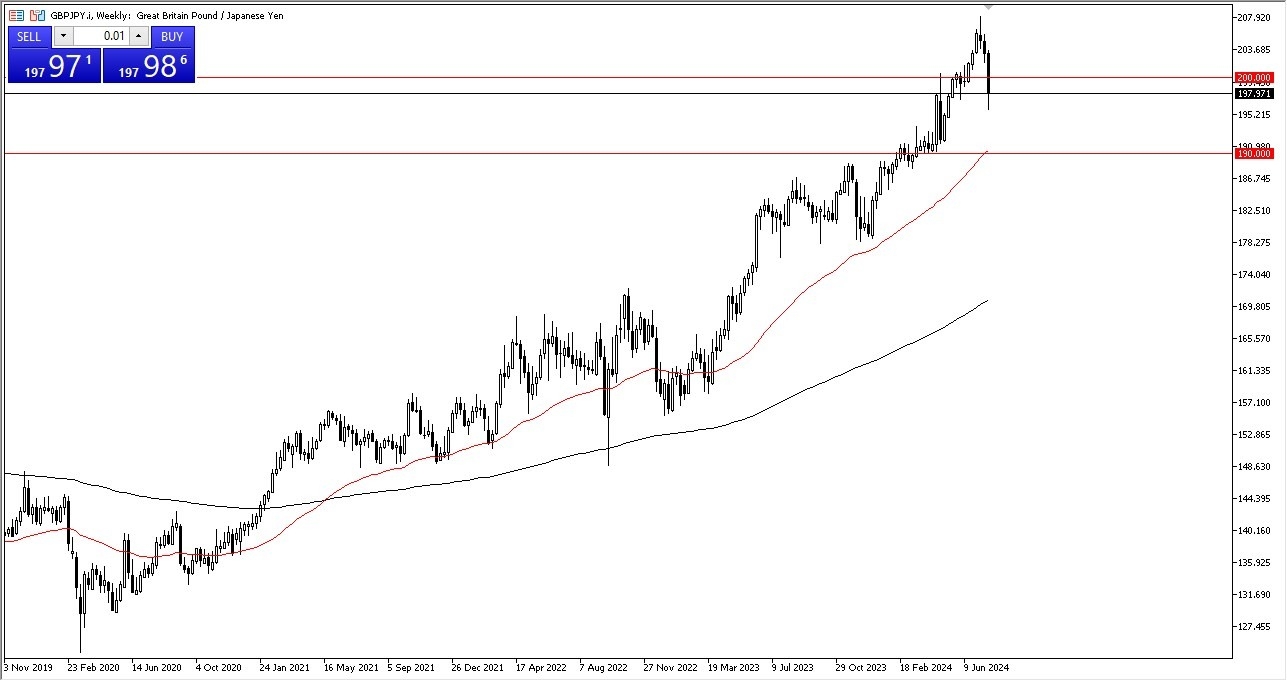
The British pound plunged against the Japanese yen during the course of the week, but it’s worth noting that the Thursday candlestick ended up being a massive hammer. The Friday session saw somewhat sideways and neutral movement, so it does make sense that we would continue to see a lot of noise going forward.
That being said, I think the market is stabilizing. If we were to see a move above the JPY198.50 level, then I think there could be an attempt to break the JPY200 level, followed by a move to the JPY206 level. I have no interest in shorting this pair, as the interest rate differential is so strong.
EUR/USD
(Click on image to enlarge)
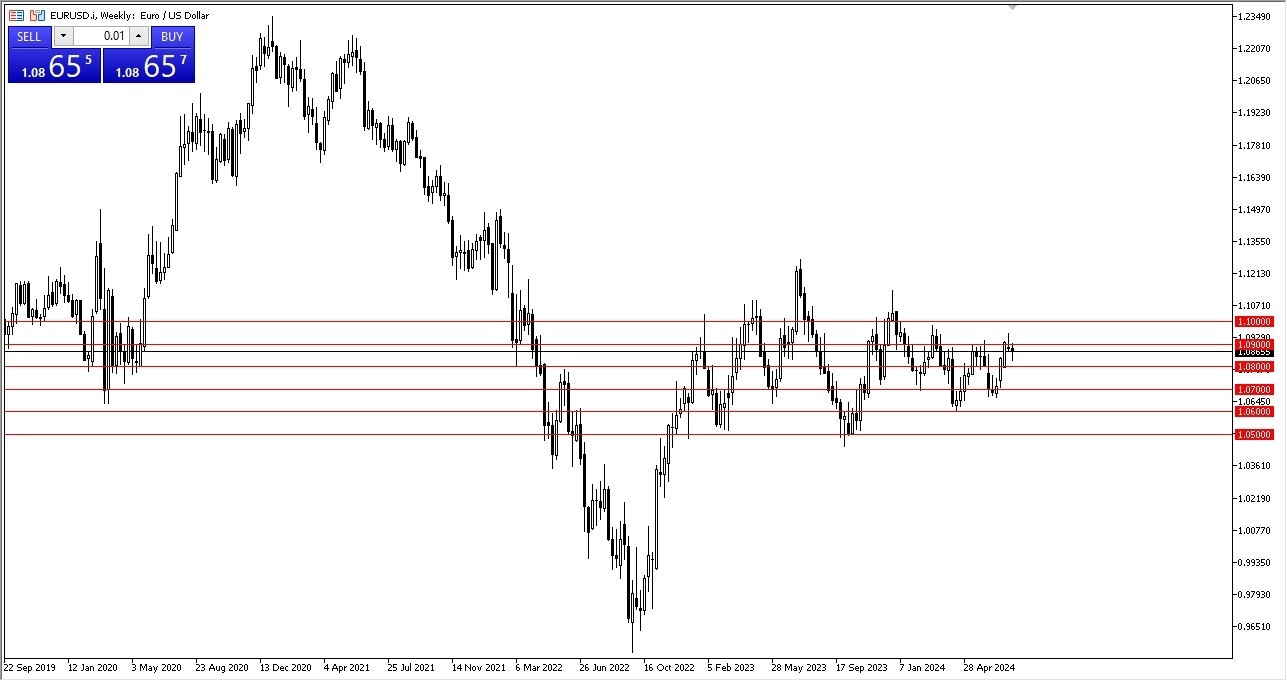
The euro initially plunged against the US dollar during the week, but it later turned around to show signs of life in order to form a hammer. This was preceded by a massive shooting star at the 1.09 level, so I think the EUR/USD pair could end up being massively neutral. Even if we do see it break out to the upside, I suspect that such a move would have more to do with the US dollar weakness than euro strength. I remain fairly flat to neutral on this pair.
More By This Author:
CAD/CHF Forecast: Will 0.63 Hold?USD/CAD Forecast: Extends Into Resistance
GBP/CHF Forecast: Drops Into Value Zone
Disclosure: DailyForex will not be held liable for any loss or damage resulting from reliance on the information contained within this website including market news, analysis, trading signals ...
more
