
During Friday's trading session, the NZD/JPY pair continued its substantial drop from Thursday, recording a further loss of 0.20% and settling at 96.65. The pair remains well below the 20-day Simple Moving Average (SMA) of 97.80, reinforcing the bearish outlook in the short term.
The daily chart signals sustained negative conditions. The Relative Strength Index (RSI) improved slightly from Thursday's session but still remains in the negative territory at 40, indicating a continued declining market momentum. The Moving Average Convergence Divergence (MACD) concurs with this scenario, printing rising red bars indicative of rising selling activity.
NZD/JPY daily chart
(Click on image to enlarge)
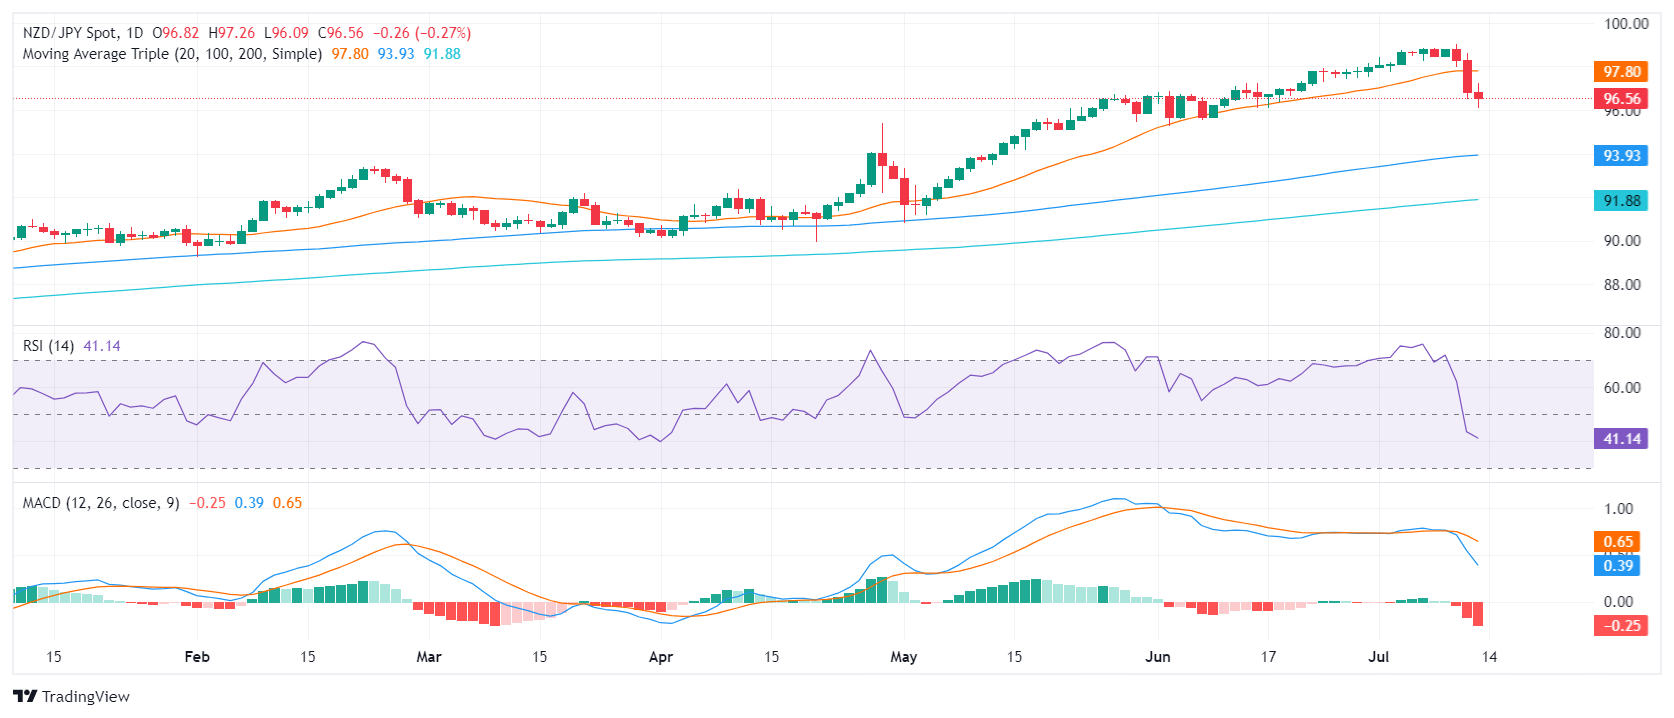
Bearing in mind the bearish momentum, immediate support levels lie at 96.50 96.00, and 95.50. Breaking these points would further validate the bearish perspective. On the other hand, resistance encounters are expected at past support levels of 97.00, 97.70 (20-day SMA), and the critical level of 98.00.
More By This Author:
AUD/JPY Price Analysis: Pair Drops To Around 107.00, Bearish Outlook AheadQuantumScape Stock Forecast: QS Shares Blast Off 17% In Second Day Of Volkswagen Production Rally
USD/CHF Price Analysis: Correcting Back In Wave C Of An ABC Pattern


Comments
Log in or sign up to join the conversation.