Nifty: The Music Will Stop
The Week Gone By
The Dream Budget cheered Dalal Street. The NSE Nifty hit an all-time high of 15,014 on Friday, Feb. 5. Banking and financials were the champions of the charts this week. Other big gainers were PSU (+25%), Bank Nifty (+17%), and the Financial sector (+15%). We had highlighted this in our previous Momentum Moves video.
The Week Ahead
February began in a party mode for the bulls. The Nifty gained 10% post budget and hit 15,000 for the first time. This historic move indicates that February is the month for the bulls, and perhaps 2021 is for the bulls, too.
Bulls may continue with the momentum in first half of the coming week. We might see the writers of 15,000 CE (Call options) come under pressure once the index sustains above this key level. The music might pause in the later half of the week, probably Tuesday or Wednesday.
00:08:13
The Music Will Stop
This stellar run of more than 10% from 13,600 to 15,000 might pause in the resistance zone of 15,070 to 15,450. Though this range is only 2-3%, it's better to be safe rather than sorry.
Nifty Weekly Chart

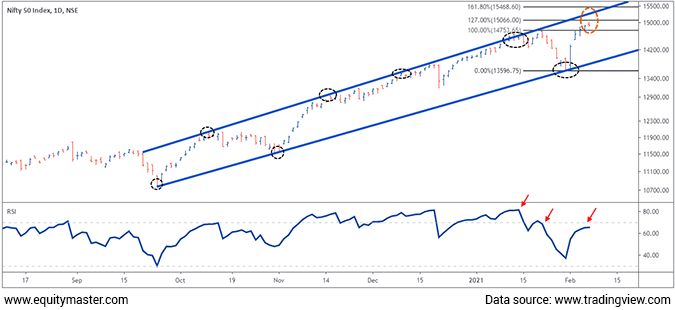
The chart above is the weekly chart. The index is trading in a rising channel formation. The Nifty had taken support right at the bottom of the rising channel ahead of closing. The fast and furious move railed towards the resistance zone.
The Fibonacci projection of 14,753 to 13,596 at the 127.20% and 161.80% resistance zone is placed at 15,066 and 15,468, respectively. The RSI (Relative Strength Index) is forming a lower high. This indicates a negative divergence, which is a sign of caution for the bulls.

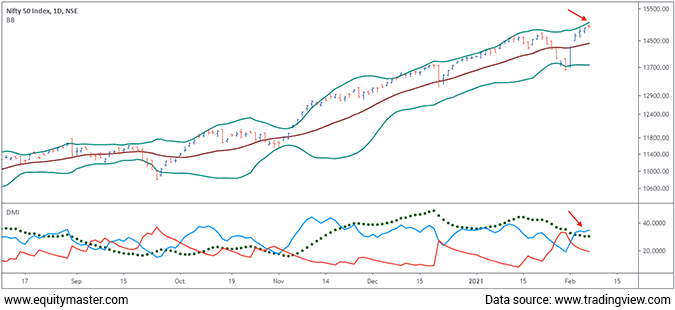
If you look at the second chart above, the index is trading around the resistance of the Bollinger band. Bollinger Bands are plotted at a standard deviation level above and below the 20-days simple moving average. The index is trading right around the upper band of the Bollinger Band that is placed at 15,080, coinciding with the 127.20% Fibonacci retracement.
The Average Directional Index (ADX) oscillator in the panel below is not a sign of a strong bullish trend. The Average Directional line (green dotted line) is sloping below the previous high.
The only case that could go in the bull's favor is seen with the Positive Directional Momentum (blue line). This has crossed above the Average Directional line and could help continue the trend. Looking at both the charts, we believe bulls should be cautious in the week ahead. Traders should trim their leveraged positions early in the week.
Auto Sector to Underperform
Auto stocks have been favored among traders these days, especially Tata Motors (TTM) and Bajaj Auto.
Nifty Auto Chart

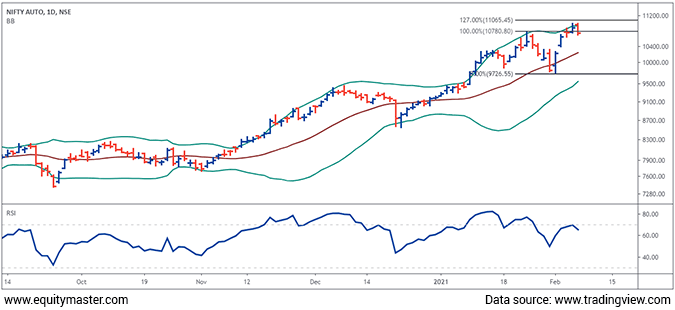
The Auto Index has been trading around the resistance level of the 127.20% Fibonacci level, which is placed at 11,065. Adding to this, the index also faced resistance at the upper area of the Bollinger Band and reversed.
The psychological resistance level of 11,000 will also be a hindrance for the bulls. The triple negative divergence on the RSI strengthens our view of a reversal. The auto sector might be the first sector we believe to end the party and head back towards the 10,000 area.
Conclusion
The music is likely to stop in the markets, and we might see the Nifty reversing next week from the resistance zone of 15,070-15,450. The auto index charts are indicating the party is over, and one should look to book profits in the short-term.
Disclosure: Equitymaster Agora Research Private Limited (Research Analyst) bearing Registration No. INH000000537 (hereinafter referred as 'Equitymaster') is an independent equity research ...
more


