
Nifty 50 Index Elliott Wave Technical Forecast
NIFTY 50 INDEX Elliott Wave Analysis – Trading Lounge Day Chart
NIFTY 50 INDEX Elliott Wave Technical Analysis
FUNCTION: Bullish Trend
MODE: Impulsive
STRUCTURE: Orange Wave 3
POSITION: Navy Blue Wave 1
DIRECTION NEXT LOWER DEGREES: Orange Wave 4
DETAILS:
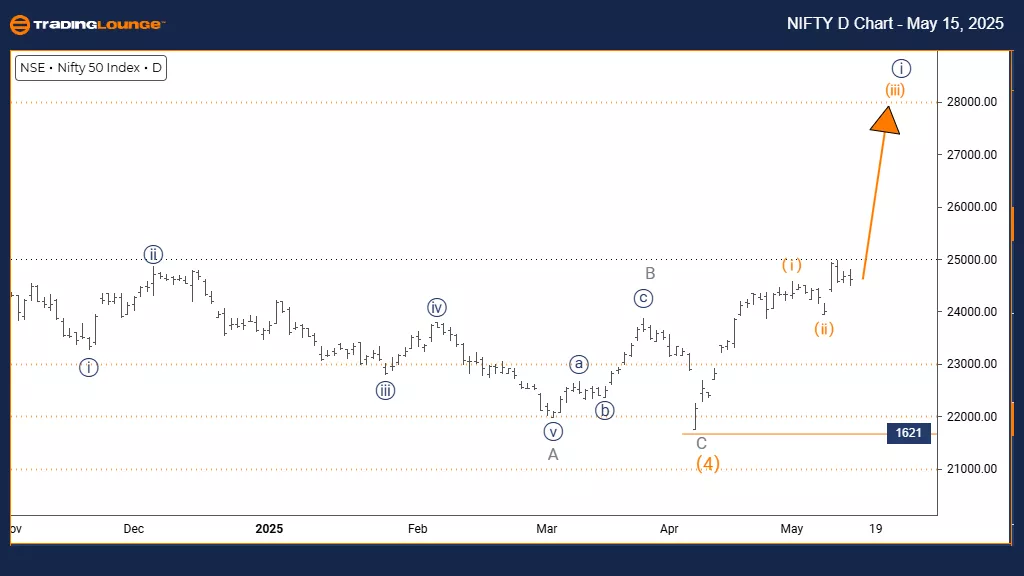
Orange Wave 2 appears completed. Orange Wave 3 is currently active.
Wave cancel invalid level: 1621
The daily chart of the Nifty 50 index displays a bullish trend with impulsive wave formation. Orange Wave 3 is currently developing within Navy Blue Wave 1, signaling the end of the prior correction in Orange Wave 2 and the beginning of a strong upward phase.
This configuration typically signals the most forceful segment of an Elliott Wave impulse, offering significant upside potential before the structure completes.
The analysis validates the conclusion of Orange Wave 2 and the progression into Orange Wave 3. A key invalidation level is identified at 1621; a break below this level would invalidate the current wave count and possibly indicate a more complex corrective move or a reversal.
The impulsive wave currently driving prices upward reflects solid institutional buying interest, suggesting a continued bullish bias with room for further gains within Navy Blue Wave 1.
Following this wave, Orange Wave 4 is expected as a corrective response after Orange Wave 3's completion. This structure helps traders place the index within its broader trend and plan around key support zones. The analysis recommends careful monitoring of price action, especially near the 1621 invalidation level, as the market moves through this dynamic upward phase.
NIFTY 50 INDEX Elliott Wave Analysis – Trading Lounge Weekly Chart
NIFTY 50 INDEX Elliott Wave Technical Analysis
FUNCTION: Bullish Trend
MODE: Impulsive
STRUCTURE: Navy Blue Wave 1
POSITION: Gray Wave 1
DIRECTION NEXT HIGHER DEGREES: Navy Blue Wave 1 (started)
DETAILS:
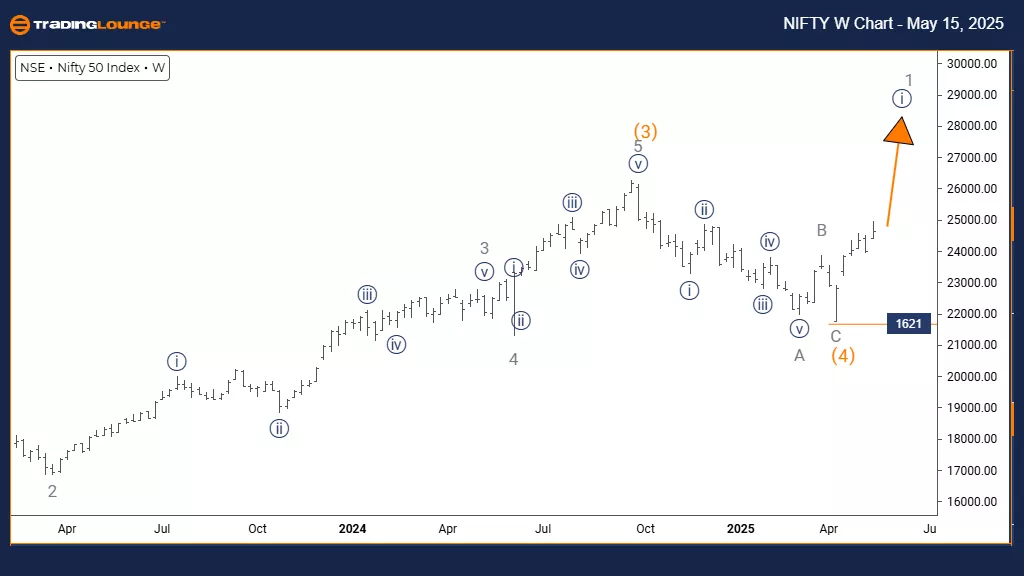
Orange Wave 4 appears completed. Navy Blue Wave 1 of 1 is currently active.
Wave cancel invalid level: 1621
The weekly chart of the Nifty 50 index reveals a strong bullish trend with clear impulsive structure. Navy Blue Wave 1 is forming within Gray Wave 1, marking the transition from a completed Orange Wave 4 to a fresh advancing sequence.
This structure indicates the beginning of a potential long-term upward move, with Navy Blue Wave 1 serving as the first leg of a broader advance within Gray Wave 1.
The analysis confirms the completion of Orange Wave 4, establishing momentum in Navy Blue Wave 1. The impulsive nature signals strong buying interest, potentially from institutions, which aligns with the bullish outlook on a weekly scale.
An important technical invalidation point stands at 1621. A move below this level would call the current wave count into question, suggesting a reevaluation or identifying a more complex correction.
This setup gives traders and investors valuable insight into the index's long-term trend. With the current wave count suggesting an early-stage impulse, the index could see extended gains. However, close monitoring of the 1621 level is crucial for risk control.
The structure supports strategic position management in this bullish environment and outlines both opportunity and key support levels. The ongoing wave may represent the start of a larger market advance.
Technical Analyst: Malik Awais
More By This Author:
Elliott Wave Technical Analysis: Ripple Crypto Price News For Thursday, May15
Technical Analysis: S&P 500, Nasdaq, DAX 40, FTSE 100, ASX 200
Elliott Wave Technical Forecast Newmont Corporation
At TradingLounge™, we provide actionable Elliott Wave analysis across over 200 markets. Access live chat rooms, advanced AI & algorithmic charting tools, and curated trade ...
more

