
New Zealand Dollar Price Outlook: Kiwi Fails Flight Into Resistance
Kiwi rallied nearly 3% against the US Dollar since the yearly lows registered last month with price responding to confluence resistance today in New York. These are the updated targets and invalidation levels that matter on the NZD/USD charts. Review this week’s Strategy Webinar for an in-depth breakdown of this setup and more.
NZD/USD DAILY PRICE CHART
(Click on image to enlarge)
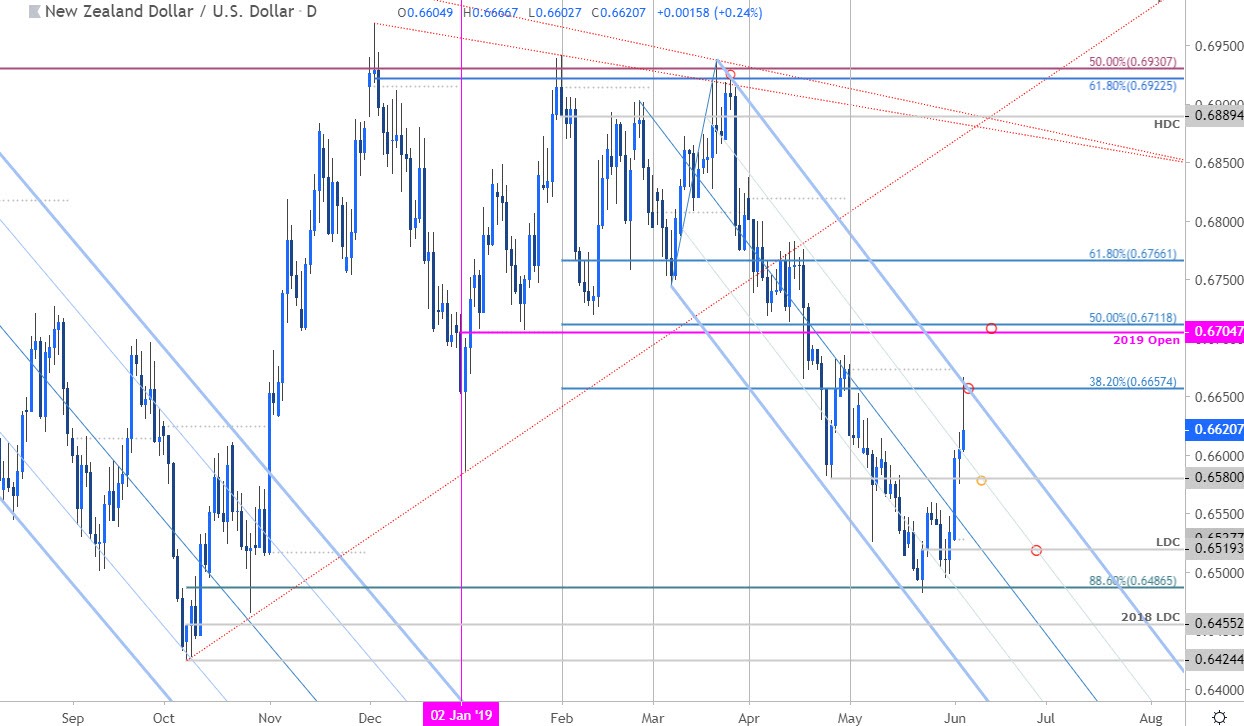
Technical Outlook: In my latest NZD/USD Weekly Price Outlook we noted that, “Failure to mark a weekly close below 6507 would leave the immediate short-bias vulnerable heading into the start of June trade.” Kiwi posted a 2% rally into the monthly open before reversing off confluence resistance at 6657 where the 38.2% retracement of the yearly range converges on the pitchfork resistance. A breach/close above this threshold is needed to keep the long-bias viable targeting the yearly open / 50% retracement at 6705/12. Interim support rests around 6570/80 with break/close below the low-day close at 6519 needed to mark resumption of the broader downtrend.
NZD/USD 120MIN PRICE CHART
(Click on image to enlarge)
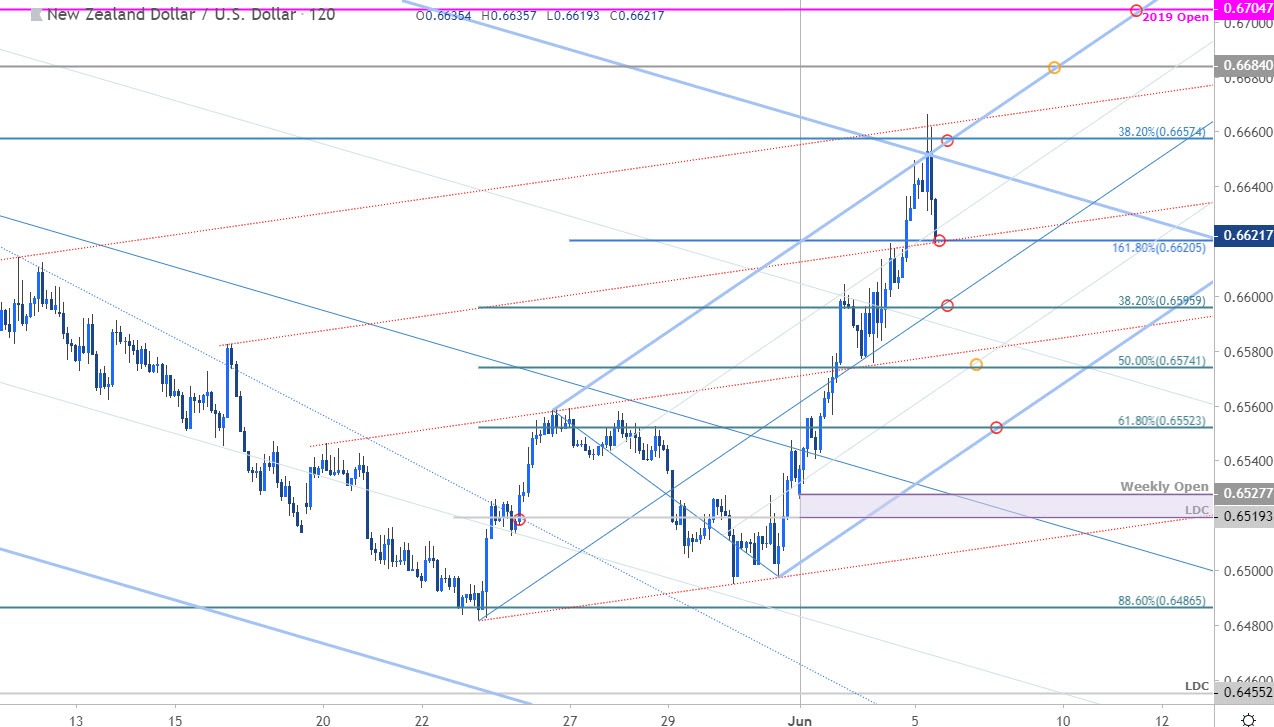
Notes: A closer look at price action shows Kiwi trading within the confines of an ascending pitchfork formation extending off the May lows with the upper parallel further highlighting the 6657 resistance zone. The pullback is now testing initial support here at 6620 – a break lower would exposes 6596 backed by 6574– both areas of interest for possible exhaustion. Bullish invalidation rests with the lower parallel / 61.8% retracement at 6552. A topside breach would keep the focus on subsequent resistance objectives at 6684and the yearly open / 50% retracement at 6705/12 – look for a bigger reaction there IF reached.
Bottom line: Kiwi has responded to near-term confluence resistance and leaves the immediate advance vulnerable while below 6657. From a trading standpoint, look for a support/price exhaustion on a pullback towards the lower parallels- ultimately, targeting a breach of this formation towards the yearly open. Keep in mind price is setting a rather wide monthly opening-range with US Non-Farm Payrolls (NFP) on tap.
NZD/USD TRADER SENTIMENT
(Click on image to enlarge)
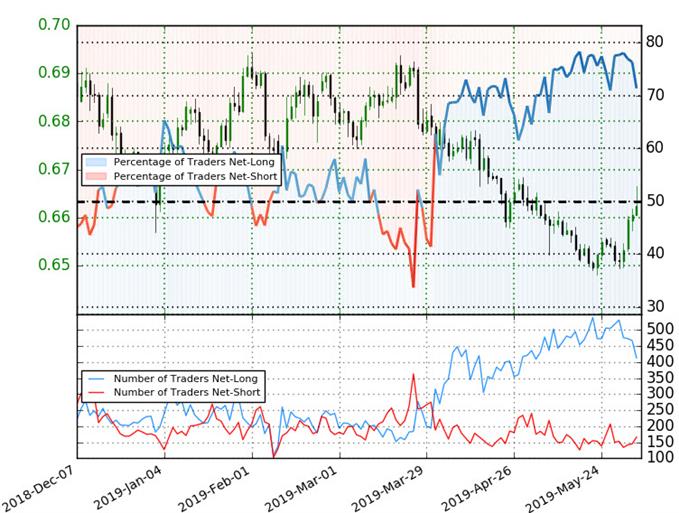
- A summary of IG Client Sentiment shows traders are net-long NZD/USD - the ratio stands at +2.49 (71.3% of traders are long) – bearish reading
- Traders have remained net-long since April 2nd; price has moved 3.6% lower since then
- Long positions are 16.6% lower than yesterday and 19.3% lower from last week
- Short positions are 11.4% higher than yesterday and 1.8% lower from last week
- We typically take a contrarian view to crowd sentiment, and the fact traders are net-long suggests Kiwi prices may continue to fall. Yet traders are less net-long than yesterday & compared with last week and the recent changes in sentiment warn that the current NZD/USD price trend may soon reverse higher, despite the fact traders remain net-long.


