
Low Volatility Strategies In Times Of High Volatility
The week ending March 20, 2020, marked one of the worst weeks for the Indian equities market, with the S&P BSE SENSEX witnessing record lows. The index recovered 5% to close at 29,915 (price return [PR]) on Friday, March 20, 2020, but it was still 17% down as compared with the week before, when it was at 34,103 (PR) on March 13, 2020. Historically, the last time the S&P BSE SENSEX witnessed such large fluctuations was on May 18, 2009, when the index gained 2,110 in a single day, increasing 17.34%.
The effect of the coronavirus has transformed global and local markets, as well as their behavior. We are witnessing a similar pattern in equities markets across the world, be it the S&P 500® in the U.S., the S&P BSE SENSEX in India, the S&P/ASX 200 in Australia, the S&P Japan 500 in Japan, or the S&P Europe 350®. Fig 1 shows the trends from February 29, 2020, to March 20, 2020.
A comparison below reflect the trend for a month and Fig 2 reflects how they have performed over longer periods in comparison to the recent short-term trend.
Fig 1 – Global Indices Movement this month
(Click on image to enlarge)
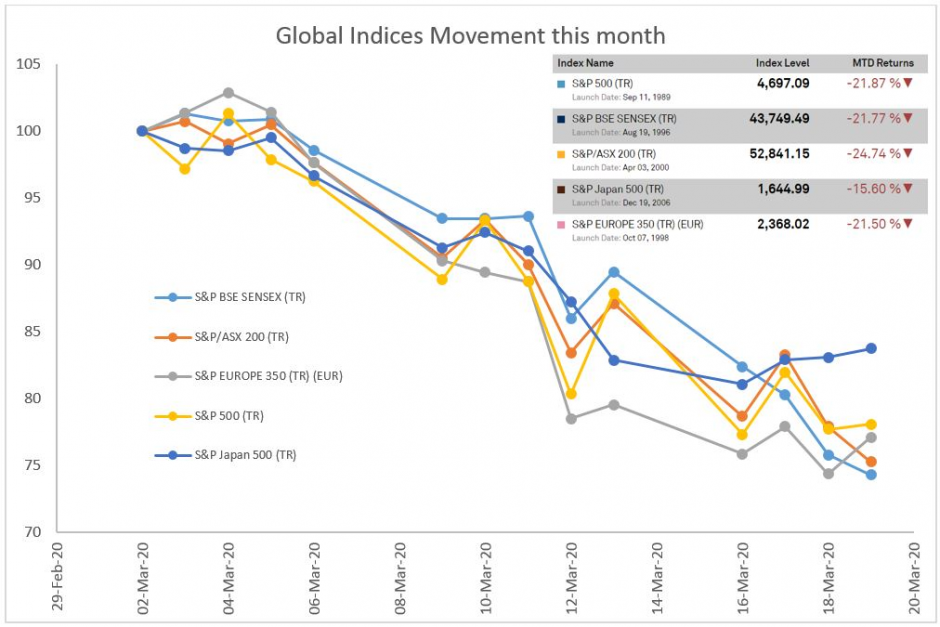
Source: S&P Dow Jones Indices LLC. Data from February 29, 2020, to March 20, 2020. Past performance is no guarantee of future results. Chart and table are provided for illustrative purposes.
Fig 2 – Comparison of Global Indices
(Click on image to enlarge)
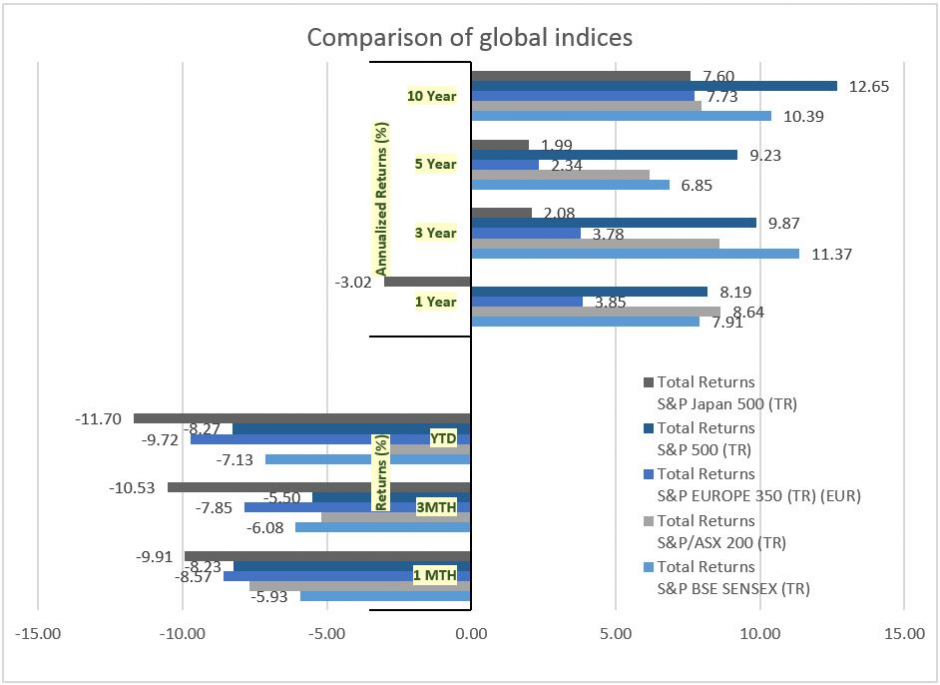
Source: S&P Dow Jones Indices LLC. Past performance is no guarantee of future results. Chart and table are provided for illustrative purposes.
Market volatility has always been a challenge, and while traders and investors could benefit from it in some markets, in other markets, appropriate strategies are available for managing this in investment portfolios. Low volatility, though an anomaly, is a strategy that works ideally in highly volatile situations.[1] We see this phenomenon across countries, and India is no different.
The S&P BSE Low Volatility Index posted a month-to-date total return of -13.96% versus the S&P BSE SENSEX’s total return of -21.72% as of March 19, 2020 (see Fig 3). If we compare the trend over longer periods, the low volatility strategy shows a similar result (see Exhibit 3). The aim of this strategy is to participate on the upside while protecting on the downside. The S&P BSE Low Volatility Index is designed to track the performance of the 30 companies in the S&P BSE LargeMidCap with the lowest volatilities, as measured by standard deviation.
Fig 3 – Movement of the Indian Indices this month
(Click on image to enlarge)

Source: S&P Dow Jones Indices LLC. Past performance is no guarantee of future results. Chart and table are provided for illustrative purposes.
Fig 4 – Performance of the S&P BSE Low Volatility Index

Source: S&P Dow Jones Indices LLC. Past performance is no guarantee of future results. Chart and table are provided for illustrative purposes.
[1] https://spindices.com/indexology/factors/is-the-low-volatility-anomaly-universal
The information provided is for informational purposes only and investors should determine for themselves whether a particular service or product is suitable for their investment needs. Graphs and ...
more

