Leadership Of Canadian Value Indices
How have value- and growth-oriented strategies performed in the Canadian equity market in recent years, especially given the recent resurgence in value-oriented companies?
Value investing is recognized as a well-known strategy that seeks to benefit from strength in fundamental characteristics of securities that might not be completely reflected in market prices, and it typically contrasts with growth strategies.
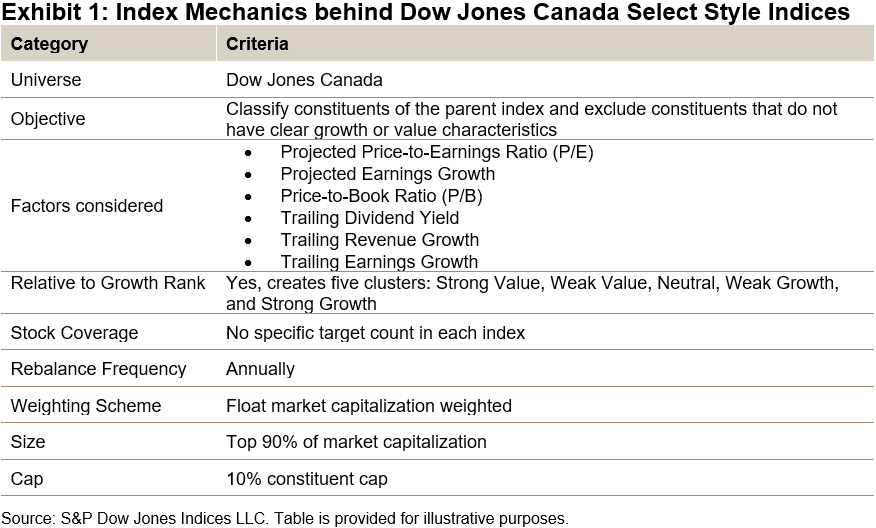
For this blog, we examine the value and growth implementation used by the Dow Jones Canada Select Style Indices, which use six metrics to determine style characteristics: two projected, two current, and two historical to classify each constituent, while small-caps are excluded altogether.
(Click on image to enlarge)

Constituent Characteristics and Recent Returns
Sector exposures for each style index contrast considerably from each other and the Canadian equity market as measured by the S&P/TSX 60. Exhibit 2 displays typical sector weights and a color scale that represents the intensity of exposure. While the S&P/TSX 60 has significant weights in the Financials and Energy sectors, the value index is exposed to these sectors primarily, and the growth index has heavier exposure to firms in the Industrials and Information Technology sectors. The growth index tends to capture a greater number of constituents and overall smaller total market capitalization than its value counterpart due to the fundamentals of the market segment. This leads to smaller size tilts in its exposure, although small-cap constituents are mainly excluded from the index universe.
(Click on image to enlarge)

These differences in sector exposure provide some insight into historical index performance. Returns of the Value index exceeded returns of its Growth counterpart and the S&P/TSX 60 over the past two years. During this time, the largest sectors within the Value index—Financials and Energy—were the best performing in the Canadian market, while the heaviest sector in the Growth index—Industrials—had only middling performance during the period and its second-largest sector was the main laggard in the Canadian market and contributed the most to the underperformance.
Exhibit 3 presents the cumulative returns for both indices and the broader Canadian market for the 20-year period, while Exhibit 4 presents the difference between rolling 12-month returns for the Value and Growth indices. A positive number in Exhibit 4 indicates outperformance in the 12-month returns by the Value index.
Over the 20-year period, the differences in performance translated into a cumulative return by the Value index that was 13% higher than the Growth index and 24% above the S&P/TSX 60. The most recent outperformance by the Value index started in 2021 and reached a magnitude not seen since 2009. This difference has translated into a higher cumulative gain than its counterpart and the Canadian benchmark.
(Click on image to enlarge)


Conclusion
Over the past two years, the Dow Jones Canada Select Value Index has outperformed its Growth counterpart and the broader Canadian equity market, while longer historical periods have also favored value. Market participants aiming to incorporate the value and growth factors may benefit from understanding the constituent selection process, index composition characteristics, and resulting historical returns of the Dow Jones Canada Select Style Indices.
More By This Author:
The S&P China 500 Dropped 20.3% In Q3 2022 As China Equities Caught Up With The Global Sell-OffTaking Higher Interest Rates In STRIDE
Spotlight On Commodities: Inflation And Innovation
Disclaimer: See the full disclaimer for S&P Dow Jones Indices here.


