
The Japanese Yen appears to be stealthily sliding while Japan are on holiday to start the week.
USD/JPY spent the entire Asian trading day above 145 in their absence. A level that had previously been seen as a line in the sand for Bank of Japan to intervene.
The US Dollar was boosted going into the weekend after solid jobs data on Friday gave Treasury yields a lift. Last week saw a parade of Fed speakers get the message across that rates will be high for a long time. The ‘big dollar’ is stronger across the board so far today.
That uptick in Treasury yields flowed into the Australian bond market. The benchmark 10-year Australian Commonwealth Government bond (ACGB) is now returning over 3.90% after dipping to 3.64% last week.
It did little to save the Aussie Dollar though, it tumbled under 0.6350 for the first time since the pandemic began and has been the worst performing major currency so far today.
The strong US economic data undermined Wall Street as fears were stoked of more jumbo hikes from the Fed.
APAC equity markets followed the lead, all finishing in the red as worries about the global growth outlook are being deepened by the impact of further rate hikes in most parts of the world.
Crude oil dipped on the negative outlook with the WTI futures contract back under US$ 92 bbl and the Brent contract nearing US$ 97 bbl.
The gold price is also under pressure, trading under US$ 1,690 an ounce.
A number of ECB and Fed speakers will be expressing their views today but the focus for this week will be US CPI that is due out on Thursday.
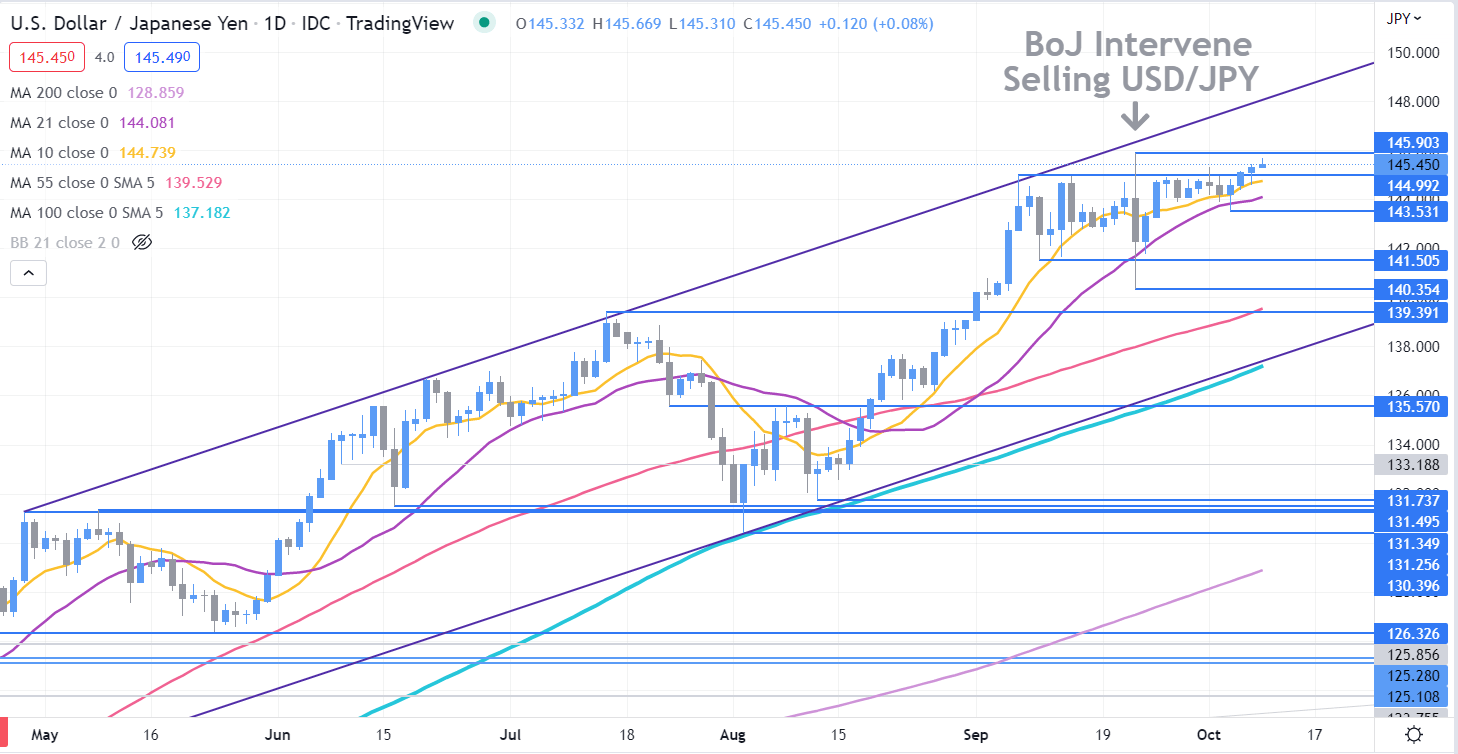
USDJPY Technical Analysis
USD/JPY remains in an ascending trend channel as it approaches the 24-year high seen last month at 145.90 and that level may offer resistance.
A bullish triple moving average (TMA) formation requires the price to be above the short term simple moving average (SMA), the latter to be above the medium term SMA and the medium term SMA to be above the long term SMA. All SMAs also need to have a positive gradient.
Looking at any combination of the 10-, 21-, 55-, 100- and 200-day SMAs and the criteria for a bullish TMA has been met.
Support could be at the recent lows and break points of 143.53, 141.50, 140.35 and 139.39.
(Click on image to enlarge)
More By This Author:
Gold Price Slips On Higher Treasury Yields Boosting The US Dollar Ahead Of US CPIAUD/USD Eyes Consumer Confidence Data Ahead Of US CPI
S&P 500, Dow Jones, Nasdaq Directional Fate Tied To CPI After NFP Selloff


Comments
Log in or sign up to join the conversation.