
Indian Stocks - Dr. Reddy Laboratories
Dr Reddy’s Laboratories Elliott Wave Analysis – Trading Lounge
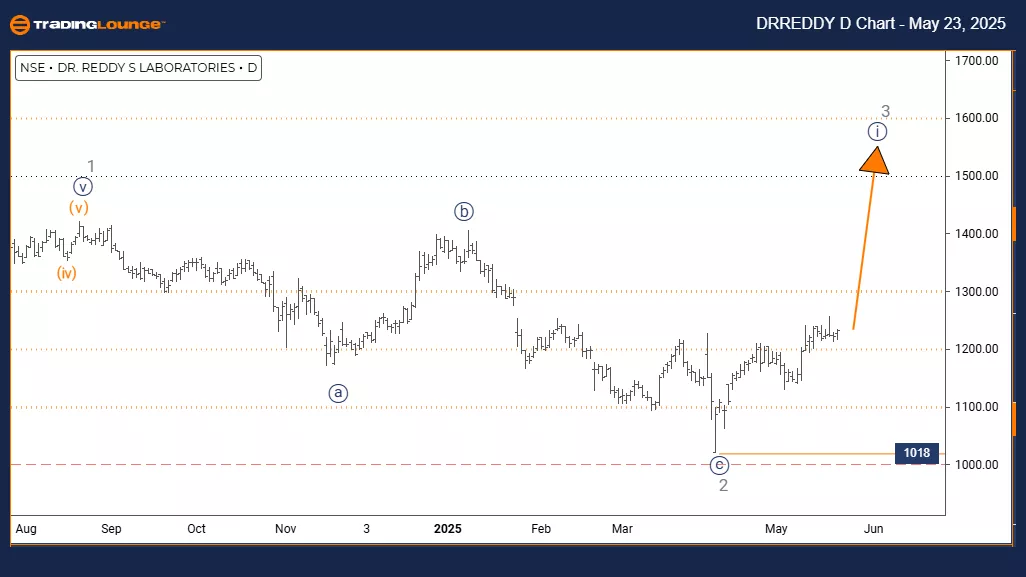
DR REDDY LABORATORIES – Day Chart
Elliott Wave Technical Analysis
FUNCTION: Bullish Trend
MODE: Impulsive
STRUCTURE: Navy Blue Wave 1
POSITION: Gray Wave 3
DIRECTION NEXT HIGHER DEGREES: Navy Blue Wave 1 (Started)
DETAILS: Gray Wave 2 appears completed; Navy Blue Wave 1 of Gray Wave 3 is now active.
WAVE CANCEL INVALID LEVEL: 1018
The daily chart analysis signals strong bullish momentum in Dr Reddy’s Laboratories, indicating the stock is in an advancing phase. The current wave structure shows Navy Blue Wave 1 progressing within the broader Gray Wave 3, following the end of Gray Wave 2’s corrective movement.
This setup marks the beginning of a potentially powerful upward phase. The impulsive characteristics suggest firm buying interest. As long as the price stays above 1018, the bullish count remains valid. A break below this level may require a technical reassessment.
This configuration provides a strategic overview for investors. With Navy Blue Wave 1 unfolding, there is potential for continued gains. The next likely phase will be the continued rise within Gray Wave 3. Traders should closely monitor for confirmation signals while staying alert to any invalidation that may affect strategy.
DR REDDY LABORATORIES – Weekly Chart
Elliott Wave Technical Analysis
FUNCTION: Bullish Trend
MODE: Impulsive
STRUCTURE: Navy Blue Wave 1
POSITION: Gray Wave 3
DIRECTION NEXT LOWER DEGREES: Navy Blue Wave 2
DETAILS: Gray Wave 2 appears completed; Navy Blue Wave 1 of Gray Wave 3 is active.
WAVE CANCEL INVALID LEVEL: 1018
The weekly chart presents a robust bullish outlook for Dr Reddy’s Laboratories, highlighting a strong impulsive move. The current pattern shows Navy Blue Wave 1 progressing within Gray Wave 3, confirming the completion of the earlier corrective phase in Gray Wave 2.
This setup indicates the beginning of a potentially extended upward trajectory. Institutional buying appears to support the move. The structure holds unless price falls below 1018, which would invalidate the count and suggest reevaluation.
For long-term investors, this chart provides essential insights. The next wave expected is Navy Blue Wave 2, which would follow the completion of the current impulsive advance. Continued monitoring of price and support levels is recommended.

Technical Analyst: Malik Awais
More By This Author:
Elliott Wave Technical Analysis: Bovespa Index - Friday, May 23
Elliott Wave Technical Analysis: Binance Crypto Price News For Friday, May 23
Elliott Wave Technical Forecast - Block, Inc.
At TradingLounge™, we provide actionable Elliott Wave analysis across over 200 markets. Access live chat rooms, advanced AI & algorithmic charting tools, and curated trade ...
more

