
Indian Stocks Coal India
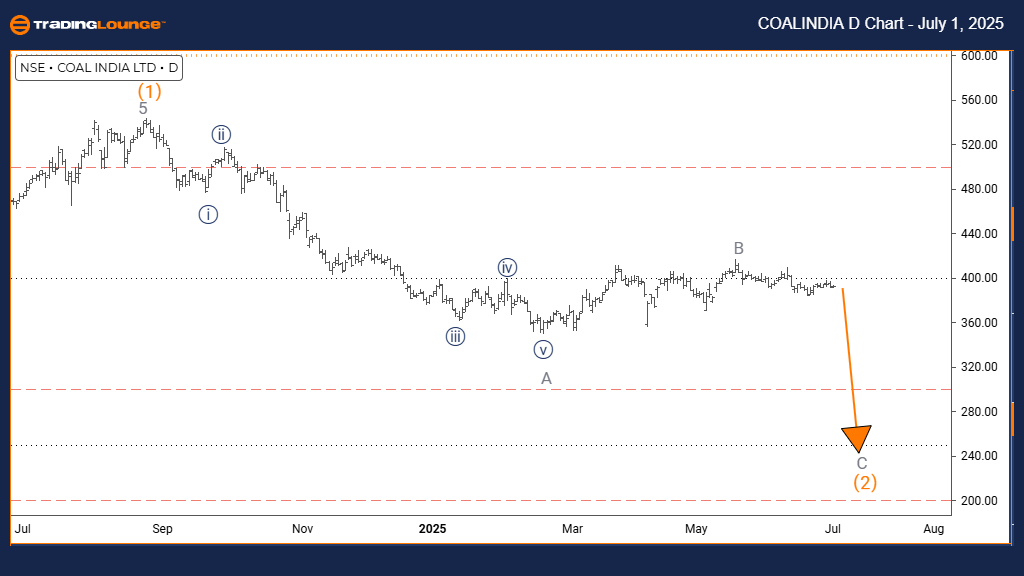
COAL INDIA Elliott Wave Analysis – TradingLounge Daily Chart
COAL INDIA Elliott Wave Technical Overview
Function: Counter-Trend
Mode: Impulsive
Structure: Gray Wave C
Position: Orange Wave 4
Direction (Lower Degrees): Gray Wave C (Started)
Details: Gray Wave B appears complete, and Gray Wave C has started.
Daily Chart Summary
The Elliott Wave analysis of COAL INDIA’s daily chart presents a counter-trend situation. The price is currently moving in an impulsive pattern, indicating a strong move in the opposite direction of the main trend. The pattern is identified as Gray Wave C, which is part of a larger correction within Orange Wave 4. This suggests the stock is likely in the final phase of this correction.
Wave B to C Transition
Gray Wave B looks completed, which has led to the development of Gray Wave C. This wave usually marks the end of a counter-trend move and typically carries momentum in the opposite direction of the primary trend. It unfolds within the broader Orange Wave 4 corrective structure.
Technical Outlook
Currently, COAL INDIA seems to be in the final stage of a counter-trend move. With Gray Wave C active and Wave B finished, there is strong impulsive selling pressure. Traders should monitor for reversal signals, as Wave C commonly marks the end of corrective movements such as Orange Wave 4.
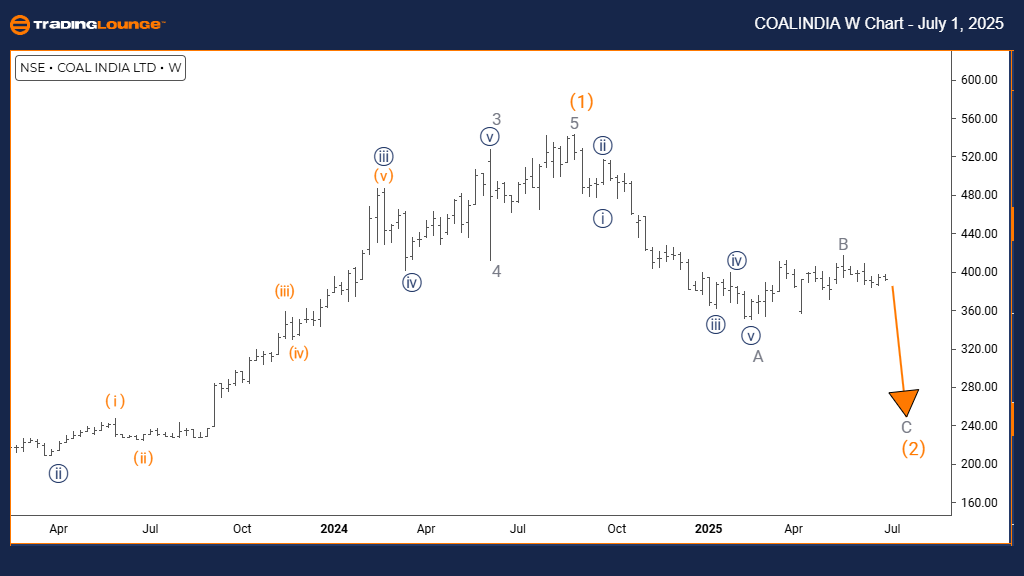
COAL INDIA Elliott Wave Analysis – TradingLounge Weekly Chart
COAL INDIA Elliott Wave Technical Overview
Function: Counter-Trend
Mode: Impulsive
Structure: Gray Wave C
Position: Orange Wave 4
Direction (Lower Degrees): Gray Wave C (Started)
Details: Gray Wave B appears complete, and Gray Wave C is underway.
Weekly Chart Summary
The Elliott Wave analysis for COAL INDIA’s weekly chart outlines a counter-trend movement. The price is moving impulsively, showing strong momentum against the dominant market direction. The ongoing structure is Gray Wave C, which is part of a broader correction under Orange Wave 4. This indicates that the stock may be nearing the end of a corrective move.
Wave B to C Shift
Gray Wave B appears to be finished, which leads into the current development of Gray Wave C. This wave often marks the final part of a corrective trend and typically carries significant momentum against the main direction. The upcoming action at lower degrees continues the Gray Wave C structure within the broader Orange Wave 4.
Technical Outlook
COAL INDIA is now in what appears to be the concluding phase of a counter-trend pattern. With Gray Wave C in motion and Wave B completed, strong impulsive selling behavior is likely. Traders should look out for signals of a possible completion, as Wave C may conclude the larger Orange Wave 4 correction.
Analyst: Malik Awais
More By This Author:
Elliott Wave Technical Analysis: BHP Group Limited
Elliott Wave Analysis Dow Jones Index
Elliott Wave Technical Analysis: British Pound/Japanese Yen - Monday, June 30
At TradingLounge™, we provide actionable Elliott Wave analysis across over 200 markets. Access live chat rooms, advanced AI & algorithmic charting tools, and curated trade ...
more

