
Indian Stocks Adani Enterprises
ADANI ENTERPRISES Elliott Wave Analysis | Trading Lounge Day Chart
ADANI ENTERPRISES Elliott Wave Technical Analysis
FUNCTION: Counter-Trend
MODE: Impulsive
STRUCTURE: Gray Wave C
POSITION: Orange Wave 2
NEXT DIRECTION (HIGHER DEGREES): Orange Wave 3
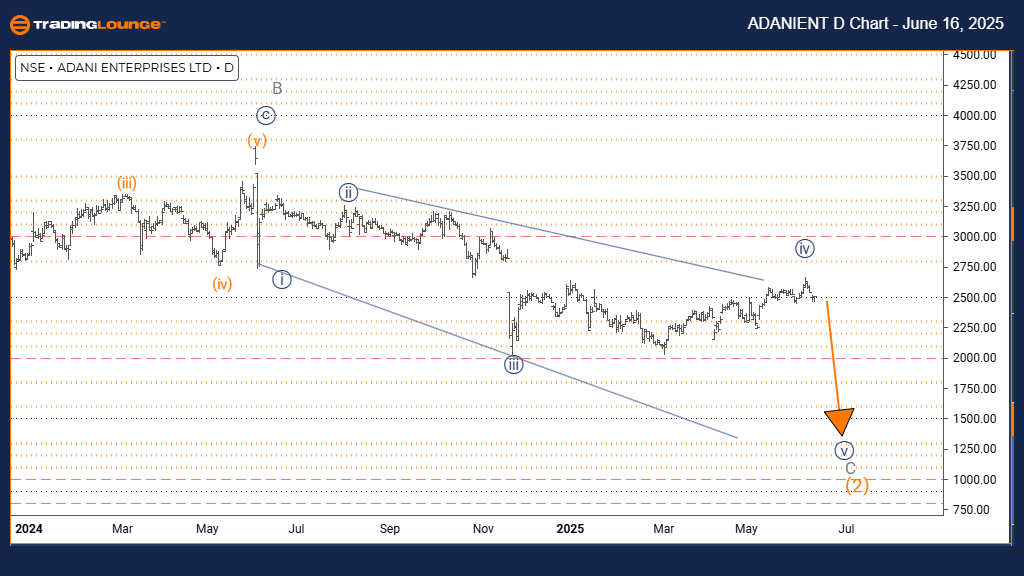
DETAILS: Gray Wave B appears completed, now Gray Wave C is developing.
The daily Elliott Wave analysis of ADANI ENTERPRISES outlines a counter-trend setup, with price action showing impulsive behavior—signaling a move against the main trend. The chart currently identifies Gray Wave C, which is part of the larger corrective pattern under Orange Wave 2. This indicates the stock is likely in the final stage of its correction, preparing to complete the counter-trend movement.
Gray Wave B looks to have finalized, and Gray Wave C has started. This wave is typically the last leg in a corrective formation and is often marked by strong momentum moving opposite to the main trend. Once Gray Wave C ends, the next expected move is Orange Wave 3, which would signal a return to the primary trend.
At present, ADANI ENTERPRISES appears to be progressing through Gray Wave C. Its impulsive nature implies strong downward activity. Traders should keep a close eye for signs of completion, as this wave finalizes the broader Orange Wave 2 correction phase.
Due to its counter-trend formation, continued downside action may persist until Gray Wave C concludes. Investors are encouraged to look out for reversal indicators that might signal the end of Gray Wave C and the entire Orange Wave 2.
ADANI ENTERPRISES Elliott Wave Analysis | Trading Lounge Weekly Chart
ADANI ENTERPRISES Elliott Wave Technical Analysis
FUNCTION: Counter-Trend
MODE: Impulsive
STRUCTURE: Gray Wave C
POSITION: Orange Wave 2
NEXT DIRECTION (HIGHER DEGREES): Orange Wave 3
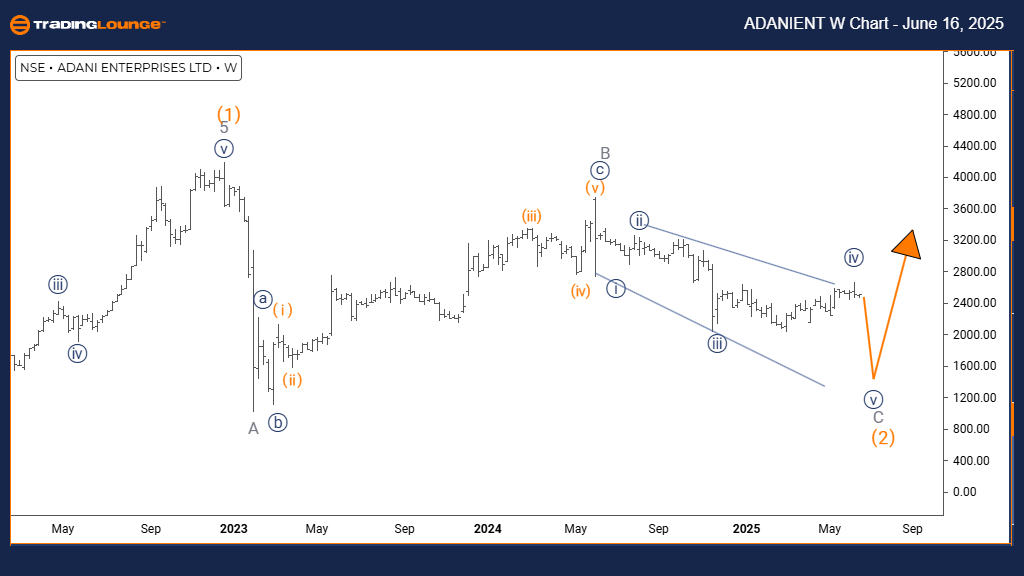
DETAILS: Gray Wave B looks completed, and Gray Wave C is now underway.
The weekly Elliott Wave analysis for ADANI ENTERPRISES shows a counter-trend condition, with price movement currently in impulsive mode—indicating strong downward force against the primary trend. The pattern is structured as Gray Wave C, part of the broader Orange Wave 2 correction. This suggests the stock is likely nearing the end of its corrective phase.
Gray Wave B appears to be finalized, giving way to Gray Wave C. This wave is often the last leg in a correction, and it typically moves with significant force opposite the main trend. Once Gray Wave C is done, the expected next move is Orange Wave 3, which may restart the main bullish trend.
At this stage, ADANI ENTERPRISES is likely going through the last part of the counter-trend correction with Gray Wave C actively forming. The impulsive characteristic implies strong downward action. Traders should closely watch for signals that may suggest a reversal and the completion of Orange Wave 2.
Market observers should pay attention to Gray Wave C's development for any signs of conclusion, which could mark the beginning of Orange Wave 3 and a shift back to the primary uptrend. Until Gray Wave C ends, continued selling pressure is expected.
Technical Analyst: Malik Awais
More By This Author:
Unlocking ASX Trading Success: BHP Group Ltd.
Elliott Wave Trading Strategies: Market Forecast For June
Elliott Wave Technical Analysis: British Pound/Australian Dollar - Friday, June 13
At TradingLounge™, we provide actionable Elliott Wave analysis across over 200 markets. Access live chat rooms, advanced AI & algorithmic charting tools, and curated trade ...
more

