

Image Source: Unsplash
- As several worries faded, the GBP/USD pair has continued its rebound.
- Markets will be influenced by US inflation statistics, UK employment figures, energy costs, and Brexit.
- Bears are in control of the daily chart as of mid-October.
The GBP/USD weekly forecast is mildly bearish as fundamental drivers keep the currency under pressure. Last week, the cable did recover because of the easing of the UK’s energy crises and the lower jobs data announcement on Friday.
However, this is a temporary pullback for the greenback, and the bears will try to take the bull’s place. The debt limit problem has been sent down the road, and energy costs have eased, allowing GBP/USD to rebound.
Lower Jobs Data
In September, the US economy added only 194,000 jobs, considerably less than projected. However, significant upward revisions and mild increases in leisure and hospitality, owing to the proliferation of the Delta variant, improve the statistics. The dollar fell, although this is expected to be short-lived as the Federal Reserve implements its taper strategy.
Energy Crises Slowed Down and Brexit Brawl
As public demand declined and British army drivers assisted in distributing fuel, UK petrol outlets saw less pressure than before. The United Kingdom and France fought over fishing rights, a minor industry, while London and Brussels tussled over the Northern Ireland agreement. The pound is still dealing with the fallout from Britain’s EU withdrawal.
Key Data Releases from the UK During the Week of Oct. 11-15

![]()
The employment report is the most important event on the UK economic calendar. Economists predict that the unemployment rate will remain unchanged in August, at 4.6%. Expectations for the Bank of England to hike rates sooner rather than later may strengthen the pound if optimistic labor data is released.
Key Data Releases in the US During the Week of Oct. 11-15

Concerns about inflation remain at the forefront of the market’s mind, and investors will watch the latest Consumer Price Index numbers for September.
GBP/USD Weekly Technical Forecast: Key Levels in Action
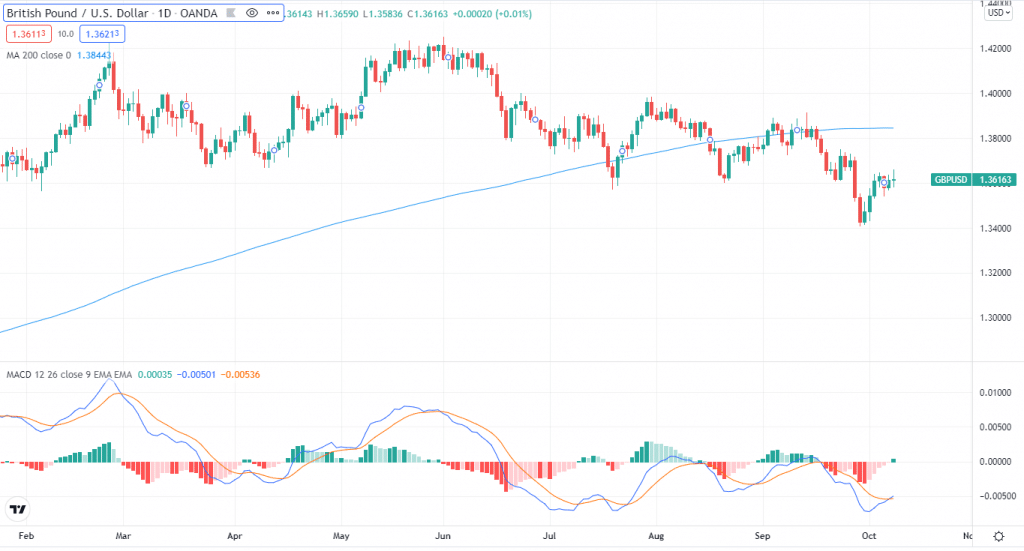
On the daily chart, the GBP/USD pair has been trading under a downtrend resistance line and has negative momentum. The cable is below the 200-day moving average, and the MACD shows a downward trajectory.
The pair found support at 1.3540 in early September, which acted as a buffer. It is followed by 1.34, the latest trough for 2021. The immediate resistance level is 1.3560, which was the October high, followed by 1.3750, the cable’s late-September high. The levels at 1.3840 and 1.3910 are the next potential targets.

Comments
Log in or sign up to join the conversation.