
GBP/USD Tumbles Under 1.3400 As Soft CPI All But Guarantees BoE Easing
Photo by Colin Watts on Unsplash|
GBP/USD drops below 1.3400 on Wednesday as the latest inflation report in the United Kingdom (UK) dipped sharply ahead of the Bank of England’s (BoE) monetary policy decision on Thursday. At the time of writing, the pair hovers around 1.3350, down 0.48%.
Sterling tumbles as November CPI undershoots forecasts
The US economic docket remains scarce, with Fed officials crossing the wires. Governor Christopher Waller —who would be interviewed by the US President Donald Trump for the top Fed Chair job — said that rate cuts have positively impacted the employment sector. He added that “inflation is unlikely to pick up again,” and that rates are 50 to 100 bps above neutral levels, but there’s no need for immediate rate cuts.
In the meantime, UK Consumer Price Index (CPI) in November dipped from 0.4% MoM to -0.2% below estimates of 0%. On an annual basis, CPI fell from 3.6% to 3.2%, missing forecasts for a drop to 3.5%.
After the data, market participants had fully priced in a BoE rate cut on Thursday, which would leave the Bank Rate at 3.75% towards the end of the year. For 2026, investors had priced in 65 bps of cuts.
The US economic docket will feature the release of the US CPI on Thursday, along with Initial Jobless Claims data for the week ending on December 13, with estimates suggesting that 225K Americans filed for unemployment benefits.
GBP/USD Price Forecast: Technical outlook
The GBP/USD upward-to-neutral bias remains intact, but inflation data prompted investors to push the pair towards a daily low of 1.3311 before trimming some of those losses. Although momentum in the short-term turned slightly bearish, the Relative Strength Index (RSI) remains bullish, an indication that further upside is seen.
If GBP/USD ends the day above 1.3400, expect some sideways price action ahead of the BoE’s decision. On the flip side, if the pair tumbles below the latter, it could fall towards the 200-day SMA at 1.3345, followed by the 1.3300 figure.
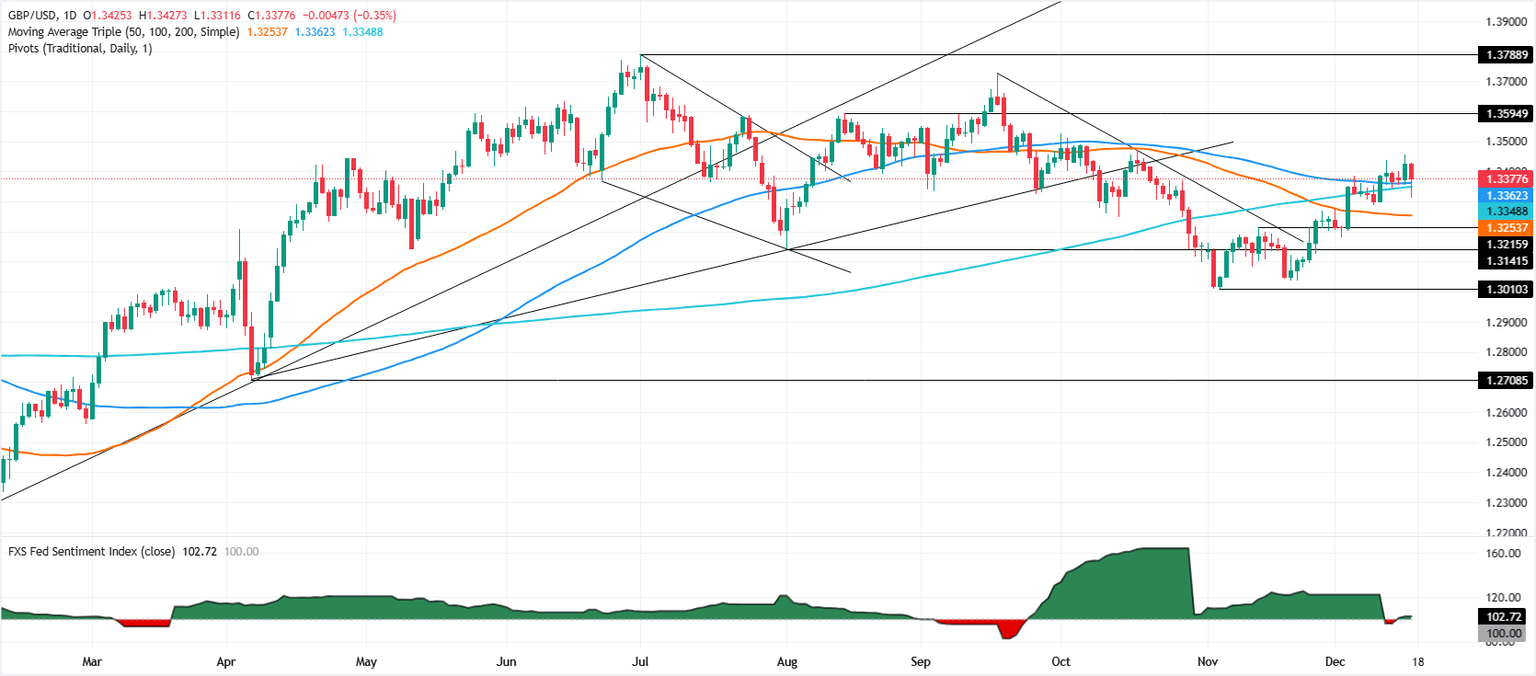
GBP/USD daily chart
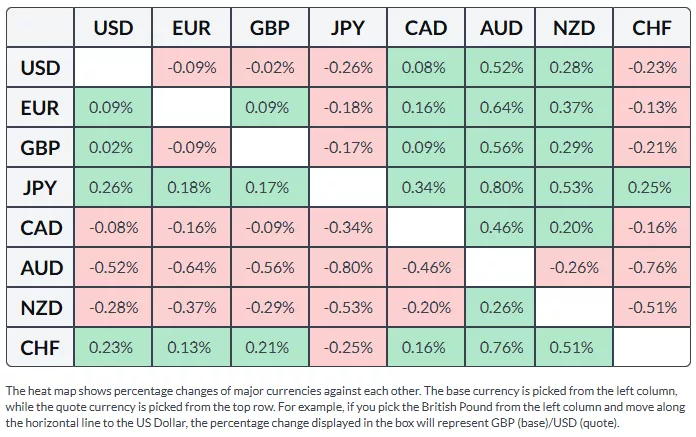
Pound Sterling Price This week
The table below shows the percentage change of British Pound (GBP) against listed major currencies this week. British Pound was the strongest against the Australian Dollar.
More By This Author:
EUR/USD Ranges Near 1.1750 As Soft U.S. Jobs Solidify Fed Easing BiasGold Eases Below $4,300 As Traders Unwind Post-NFP Gains
GBP/USD Erupts As Soft US Jobs Data Crush The Dollar


