
GBP/USD Rebounds To Hold Firm To Congestion Ahead Of Key US PPI Inflation
Photo by Colin Watts on Unsplash
- GBP/USD pared previous losses to hold tightly to the 1.3550 level on Wednesday.
- Mid-tier UK data smattered across the data docket on Thursday.
- US business-level PPI inflation figures are due on Thursday after cool CPI print.
GBP/USD found some bullish tailwinds on Wednesday, erasing the previous session’s gains and climbing back into the 1.3550 level. Cooler-than-expected US Consumer Price Index (CPI) inflation figures from the initial post-tariff reference period bolstered investor hopes for Federal Reserve (Fed) interest rate cuts later this year, and US Producer Price Index (PPI) business-level inflation will follow up on Thursday.
UK economic data remains limited through this week. A monthly Gross Domestic Product (GDP) update from April is due on Thursday; however, the backdated growth figures are from April and are unlikely to have a material impact. UK Industrial and Manufacturing Production data is also due on Thursday, and is broadly expected to begrudgingly hold in contraction territory.
On the American side of the Atlantic, US PPI inflation data is due on Thursday. Core US PPI business-level inflation through the year ended in May is expected to hold flat at 3.1% YoY.
After two days of private trade talks held in London, delegates from the Trump administration and the Chinese government have reached a preliminary trade policy framework, which now heads to the respective desks of Presidents Trump and Xi. According to social media posts by President Trump, tariffs on Chinese goods are being held at 55%, with China maintaining its 10% import tax on all American-made goods.
GBP/USD price forecast
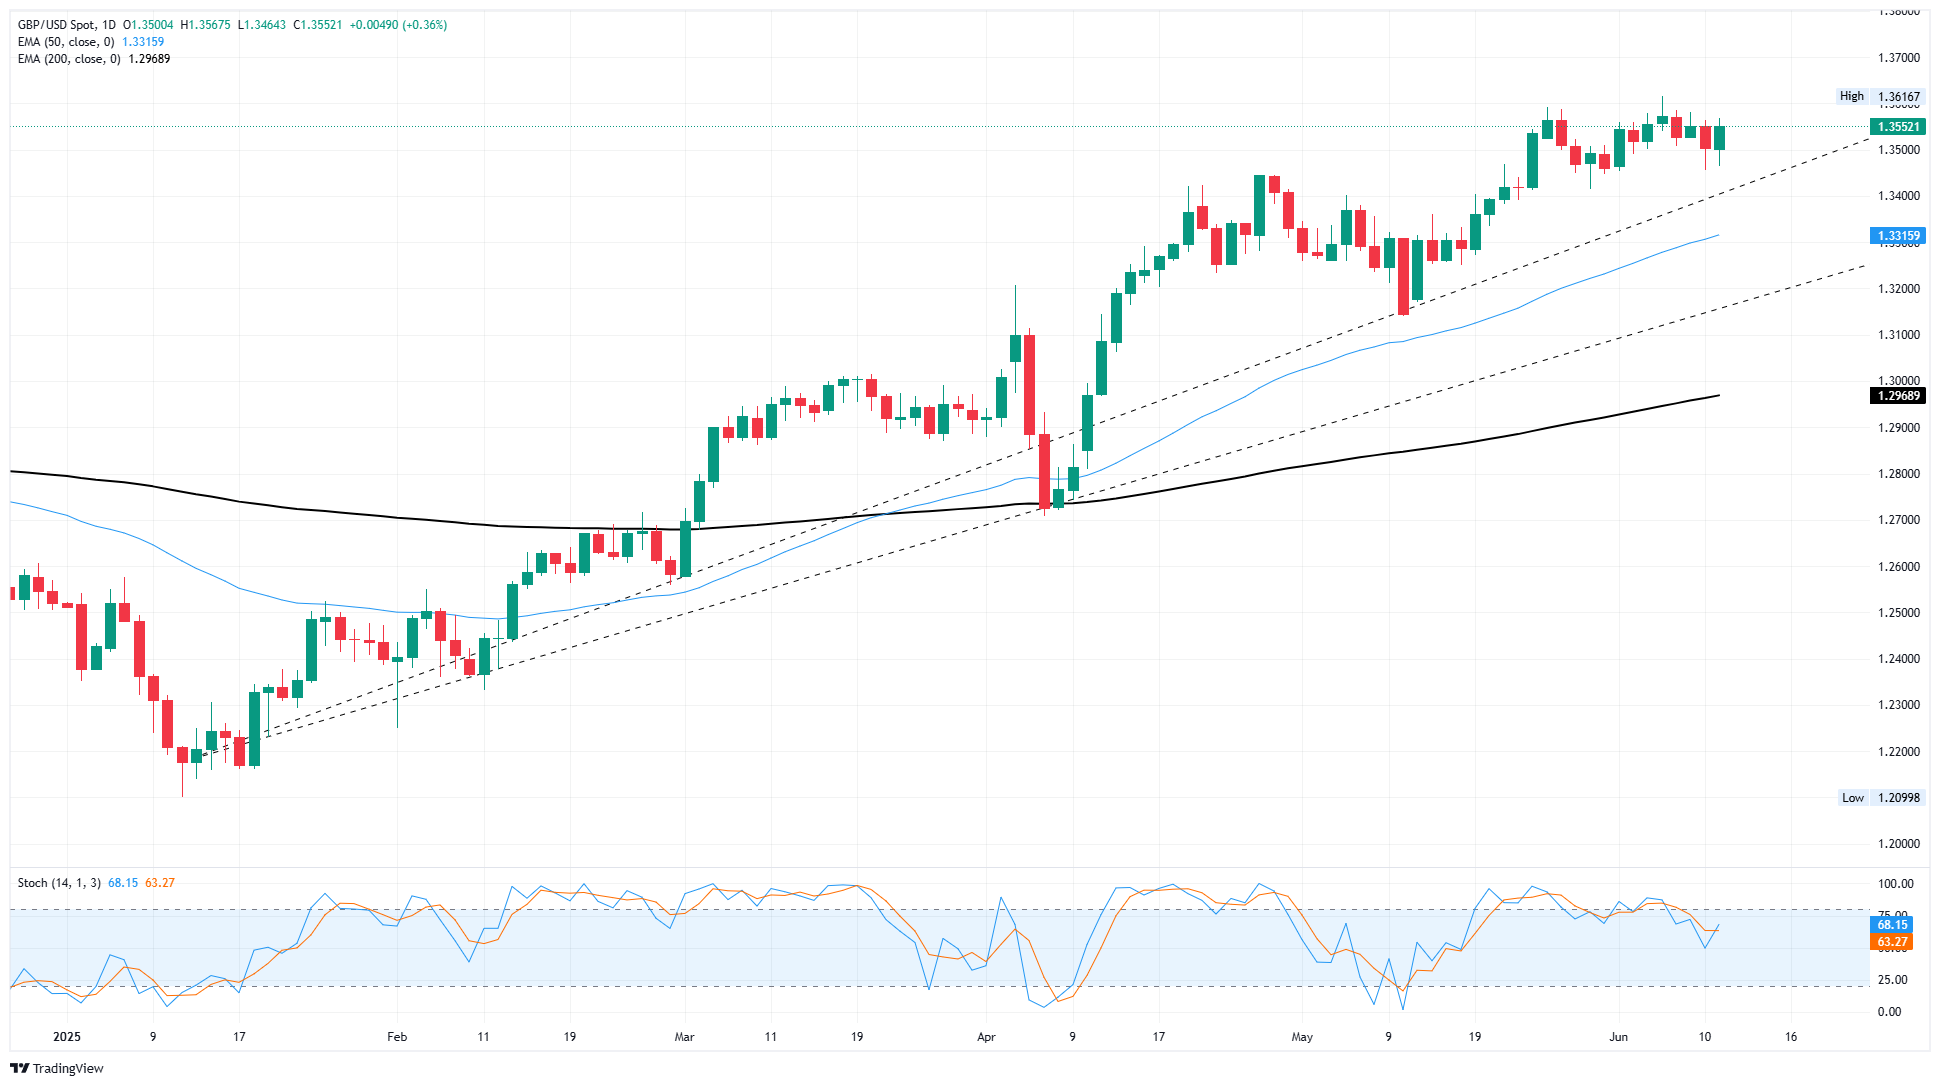
The GBP/USD currency pair has experienced a withdrawal from its multi-year highs; nevertheless, interest in Cable remains robust. The pair maintains stability within a short-term consolidation range near 1.3500 and continues to demonstrate a pronounced bullish inclination, with prices significantly surpassing the 200-day Exponential Moving Average (EMA), which is situated near 1.2960.
GBP/USD daily chart
More By This Author:
Canadian Dollar Holds Steady Amid Greenback WeaknessCanadian Dollar Trades Steady As Loonie Bidding Holds Firm
Silver Price Forecast: XAG/USD Continues To Soar Amid Perfect Storm Conditions


