GBP/USD Price Analysis: Remains Depressed Below 1.2800, Bullish Potential Seems Intact
Image Source: Unsplash
- GBP/USD ticks lower on Thursday amid the emergence of some USD buying.
- The divergent BoE-Fed policy expectations should limit any meaningful slide.
- Any further decline might find support near the 1.2750 resistance breakpoint.
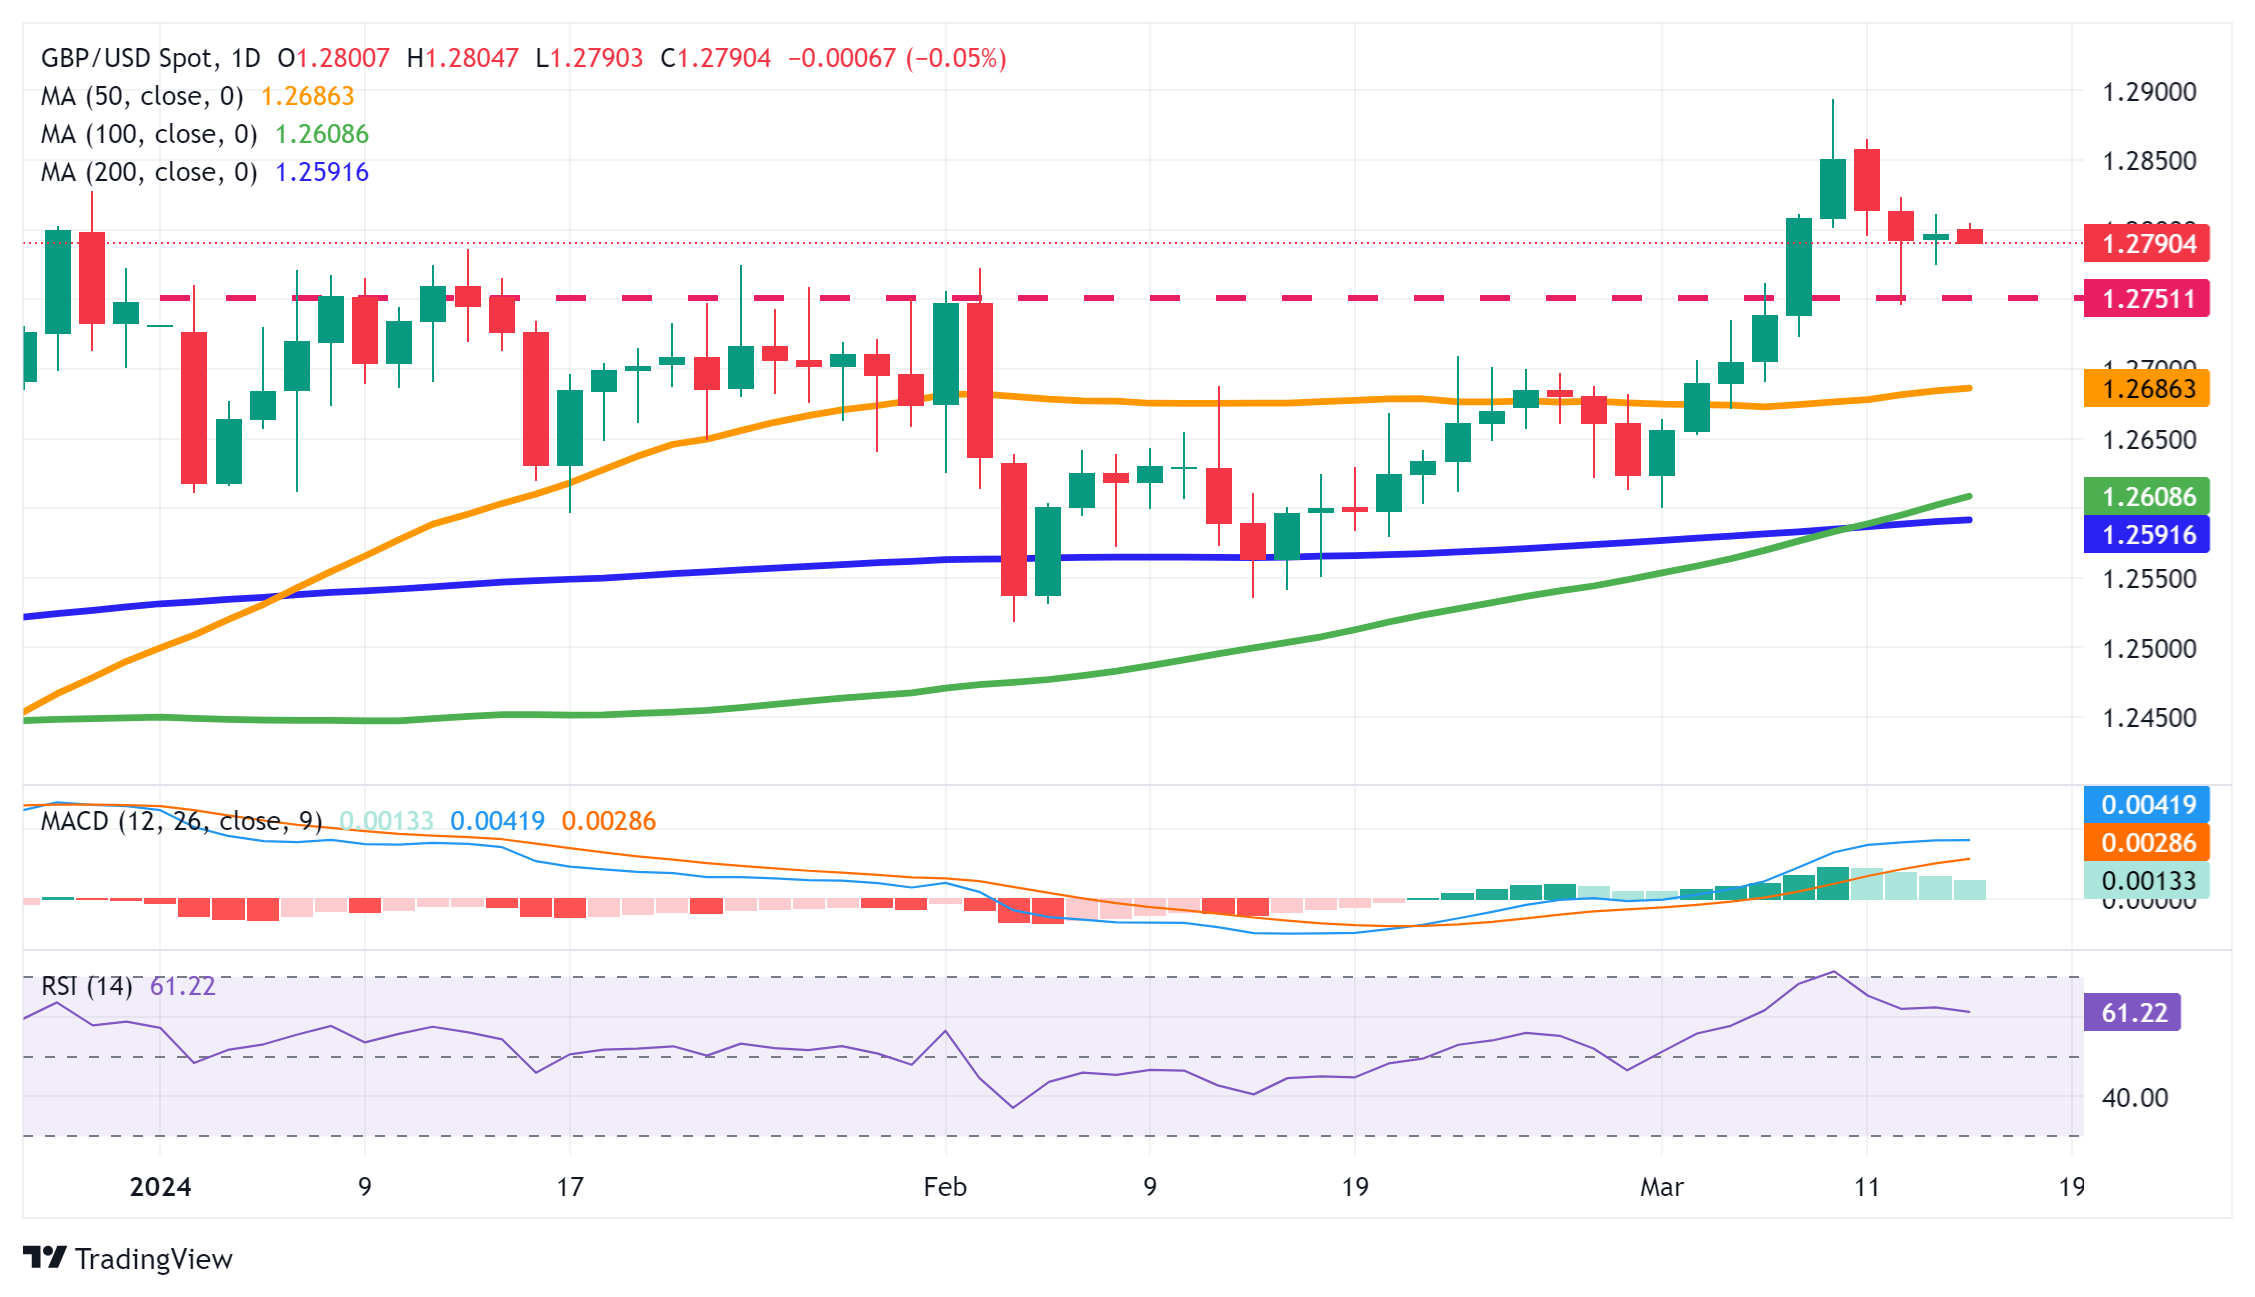
The GBP/USD pair continues with its struggle to gain any meaningful traction and extends its consolidative price move around the 1.2800 mark for the second successive day on Thursday. The setup, meanwhile, seems tilted in favour of bullish traders and warrants some caution before positioning for an extension of the recent pullback from the vicinity of the 1.2900 round figure, or the highest level since July 2023 touched last week.
The British Pound (GBP) might continue to draw support from expectations that the Bank of England (BoE) might keep interest rates higher for longer. In contrast, investors seem convinced that the Federal Reserve (Fed) will start cutting interest rates at the June policy meeting. This, along with the underlying strong bullish sentiment around the global equity markets, should cap the upside for the safe-haven Greenback and act as a tailwind for the GBP/USD pair.
Even from a technical perspective, the recent breakout through the 1.2750 horizontal barrier validates the near-term positive outlook. Adding to this, oscillators on the daily chart – though have eased from higher levels – are holding comfortably in the bullish territory and suggest that the path of least resistance for the GBP/USD pair is to the upside. Hence, any further decline might continue to attract some buyers near the 1.2750 resistance breakpoint.
The said area should act as a key pivotal point, which if broken decisively could drag the GBP/USD pair below the 1.2700 mark, towards testing the 50-day Simple Moving Average (SMA) support near the 1.2680 zone. Some follow-through selling might expose the 1.2600 confluence, comprising the 100- and the very important 200-day SMAs. The subsequent slide could turn spot prices vulnerable to retest the YTD low, around the 1.2520-1.2515 region touched in February.
On the flip side, any meaningful positive move beyond the 1.2800 mark is likely to confront some resistance near the weekly swing high, around the 1.2850-1.2860 region. A sustained strength beyond should allow the GBP/USD pair to make a fresh attempt towards conquering the 1.2900 round figure. Some follow-through buying will be seen as a fresh trigger for bulls and lift spot prices to the 1.2940-1.2945 intermediate hurdle en route to the 1.3000 psychological mark.
GBP/USD daily chart
GBP/USD
| OVERVIEW | |
|---|---|
| Today last price | 1.279 |
| Today Daily Change | -0.0007 |
| Today Daily Change % | -0.05 |
| Today daily open | 1.2797 |
| TRENDS | |
|---|---|
| Daily SMA20 | 1.2694 |
| Daily SMA50 | 1.2684 |
| Daily SMA100 | 1.2602 |
| Daily SMA200 | 1.259 |
| LEVELS | |
|---|---|
| Previous Daily High | 1.2812 |
| Previous Daily Low | 1.2775 |
| Previous Weekly High | 1.2894 |
| Previous Weekly Low | 1.2652 |
| Previous Monthly High | 1.2773 |
| Previous Monthly Low | 1.2518 |
| Daily Fibonacci 38.2% | 1.2797 |
| Daily Fibonacci 61.8% | 1.2789 |
| Daily Pivot Point S1 | 1.2777 |
| Daily Pivot Point S2 | 1.2758 |
| Daily Pivot Point S3 | 1.2741 |
| Daily Pivot Point R1 | 1.2814 |
| Daily Pivot Point R2 | 1.2831 |
| Daily Pivot Point R3 | 1.2851 |
More By This Author:
Tesla Stock Forecast: TSLA Sinks To Lowest Level In 10 Months Following Price Target Cut To $125AUD/USD Rises On RBA’s Relatively Hawkish Stance
EUR/GBP Price Analysis: A downside break would be volatile
Disclosure: Information on this article contains forward-looking statements that involve risks and uncertainties. Markets and instruments profiled on this page are for informational purposes ...
more


