GBP/USD Price Analysis: Mean Reversion To Near 20-EMA Around 1.2050 Looks Likely
The GBP/USD pair has extended its losses below 1.2230 in the Asian session after failing to sustain above the round-level resistance of 1.2300. The Cable is facing the heat of risk-aversion theme as investors are getting anxious ahead of the monetary policy announcement by the Federal Reserve (Fed) and the Bank of England (BOE).
The US Dollar Index (DXY) has climbed firmly to near 105.20 in Tokyo and is expected to extend gains further amid an improvement in safe-haven’s appeal. Meanwhile, the 10-year US Treasury yields are hovering above 3.5%.
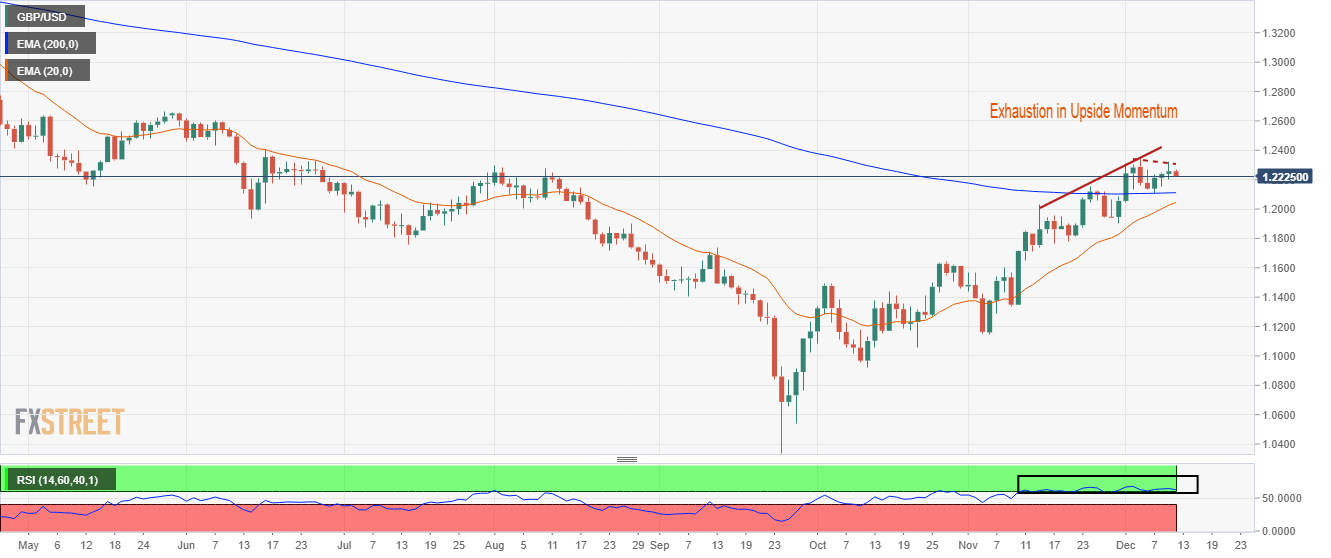
On a daily scale, the Cable is continuously moving north and has not displayed a mean-reversion to near 20-period Exponential Moving Average (EMA). No trend can be undisputed for a secular period, therefore, a corrective move to near the 20-EMA cannot be ruled out. Also, the Pound Sterling has shown signs of exhaustion in the upside trend.
The Cable is auctioning above the 200-EMA at 1.2116, which indicates that the upside trend is still intact.
Meanwhile, a continuous oscillation in the bullish range of 60.00-80.00 by the Relative Strength Index (RSI) (14) is showing signs of overbought.
Should the Cable drops below Friday’s low around 1.2200, the US Dollar bulls will drag the asset towards the 200-EMA at 1.2116 and the 20-EMA at 1.2050.
On the contrary, a decisive break above December 5 high at 1.2345 will drive the asset toward the round-level resistance at 1.2400, followed by the psychological resistance at 1.2500.
GBP/USD daily chart
(Click on image to enlarge)
GBP/USD
| OVERVIEW | |
|---|---|
| Today last price | 1.2225 |
| Today Daily Change | -0.0032 |
| Today Daily Change % | -0.26 |
| Today daily open | 1.2257 |
| TRENDS | |
|---|---|
| Daily SMA20 | 1.2039 |
| Daily SMA50 | 1.1632 |
| Daily SMA100 | 1.1667 |
| Daily SMA200 | 1.2121 |
| LEVELS | |
|---|---|
| Previous Daily High | 1.2323 |
| Previous Daily Low | 1.2201 |
| Previous Weekly High | 1.2345 |
| Previous Weekly Low | 1.2107 |
| Previous Monthly High | 1.2154 |
| Previous Monthly Low | 1.1147 |
| Daily Fibonacci 38.2% | 1.2276 |
| Daily Fibonacci 61.8% | 1.2248 |
| Daily Pivot Point S1 | 1.2198 |
| Daily Pivot Point S2 | 1.2139 |
| Daily Pivot Point S3 | 1.2077 |
| Daily Pivot Point R1 | 1.232 |
| Daily Pivot Point R2 | 1.2382 |
| Daily Pivot Point R3 | 1.2441 |
More By This Author:
S&P 500 Futures, Us Treasury Bond Yields Portray Market Fears, Focus On Recession, FedEUR/USD Price Analysis: Bulls Eye A Break Of Key 1.0550 Area, Eyes On 1.0600
Fed's Powell To Push Back Against Rate Cuts In 2023 – Rabobank
Disclaimer: Information on these pages contains forward-looking statements that involve risks and uncertainties. Markets and instruments profiled on this page are for informational purposes only ...
more


