
GBP/USD Flattens Ahead Of UK Retail Sales
Photo by Colin Watts on Unsplash
- GBP/USD pumped the brakes on Thursday, stuck near 1.3400.
- UK Retail Sales in the barrel for Friday, investors expect a third straight decline.
- Cable markets are losing steam after tapping fresh multi-year highs this week.
GBP/USD treaded water on Thursday, marking in a tight circle just north of the 1.3400 handle as global market sentiment suffers knock-on effects from a recent bout of worry that shot through Treasury yields this week. Investors are broadly focusing on the United States’ (US) mounting debt problems, which are poised to get a fresh injection (in the wrong direction) as President Donald Trump’s deficit-swelling “big, beautiful” tax and budget bill grinds its way through Congress.
UK Retail Sales (and not much else) in the Friday pipeline
United Kingdom (UK) Retail Sales lie ahead as the final key data release this week. UK Retail Sales in April are expected to show a third consecutive monthly decline, with median market forecasts prepped for a slide to 0.2% MoM from March’s 0.4%. Annualized Retail Sales are forecast to jump to 4.5% YoY from 2.6%, but Pound Sterling traders will be keeping a closer eye on the slowdown at the front end of the curve.
Markets on both sides of the Pacific will be wrapping the trading week up on Friday heading into a long weekend. Banks, brokers, and exchanges will be dark on Monday with dual holidays: the Spring Break Holiday in the UK, and Memorial Day in the US. Next week’s economic calendar is also notably dry on the Pound Sterling side, leaving Cable traders at the mercy of any shifts in broader market sentiment.
GBP/USD price forecast
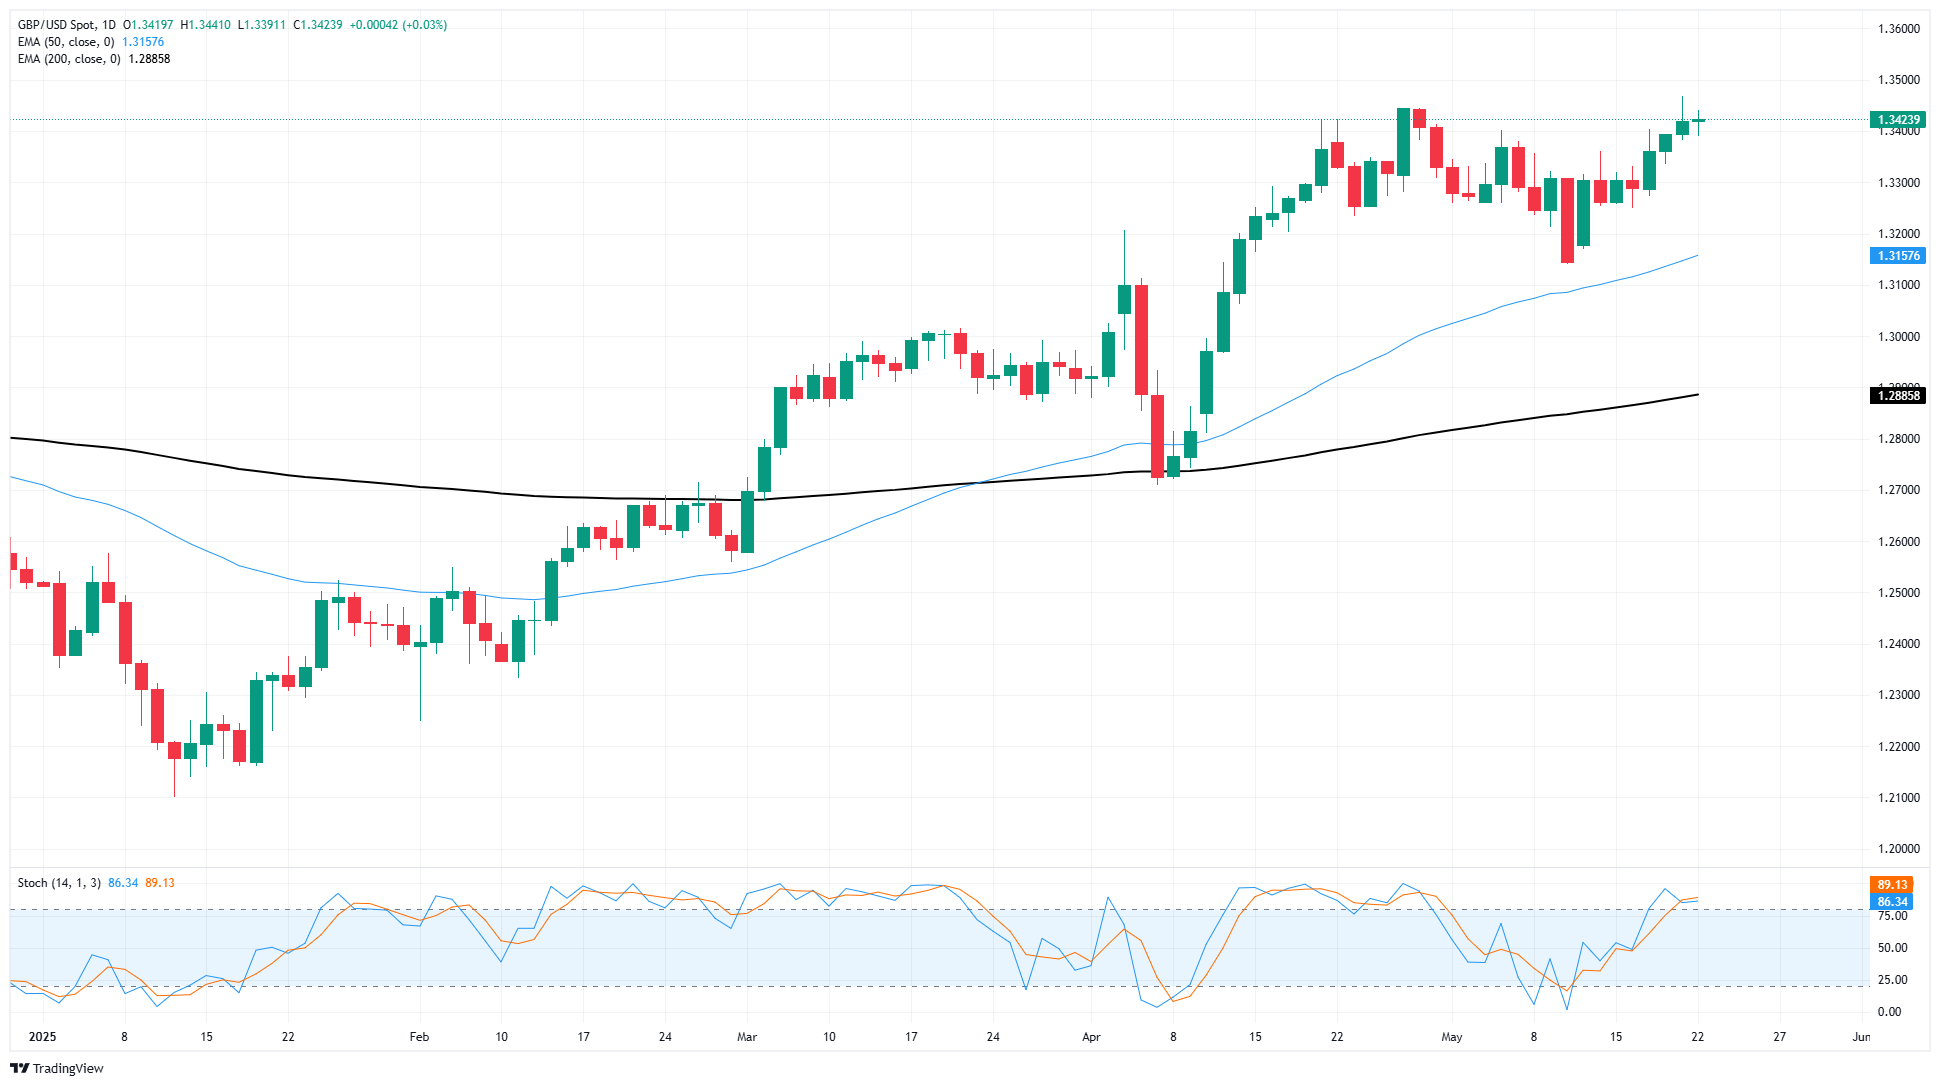
Overall, the Pound Sterling has been on a tear in 2025, rising 11.3% bottom-to-top from mid-January’s multi-month bottoms at the 1.2100 handle. Cable has entirely reversed losses through the last quarter of 2024, rising to multi-year highs near 1.3450 this week.
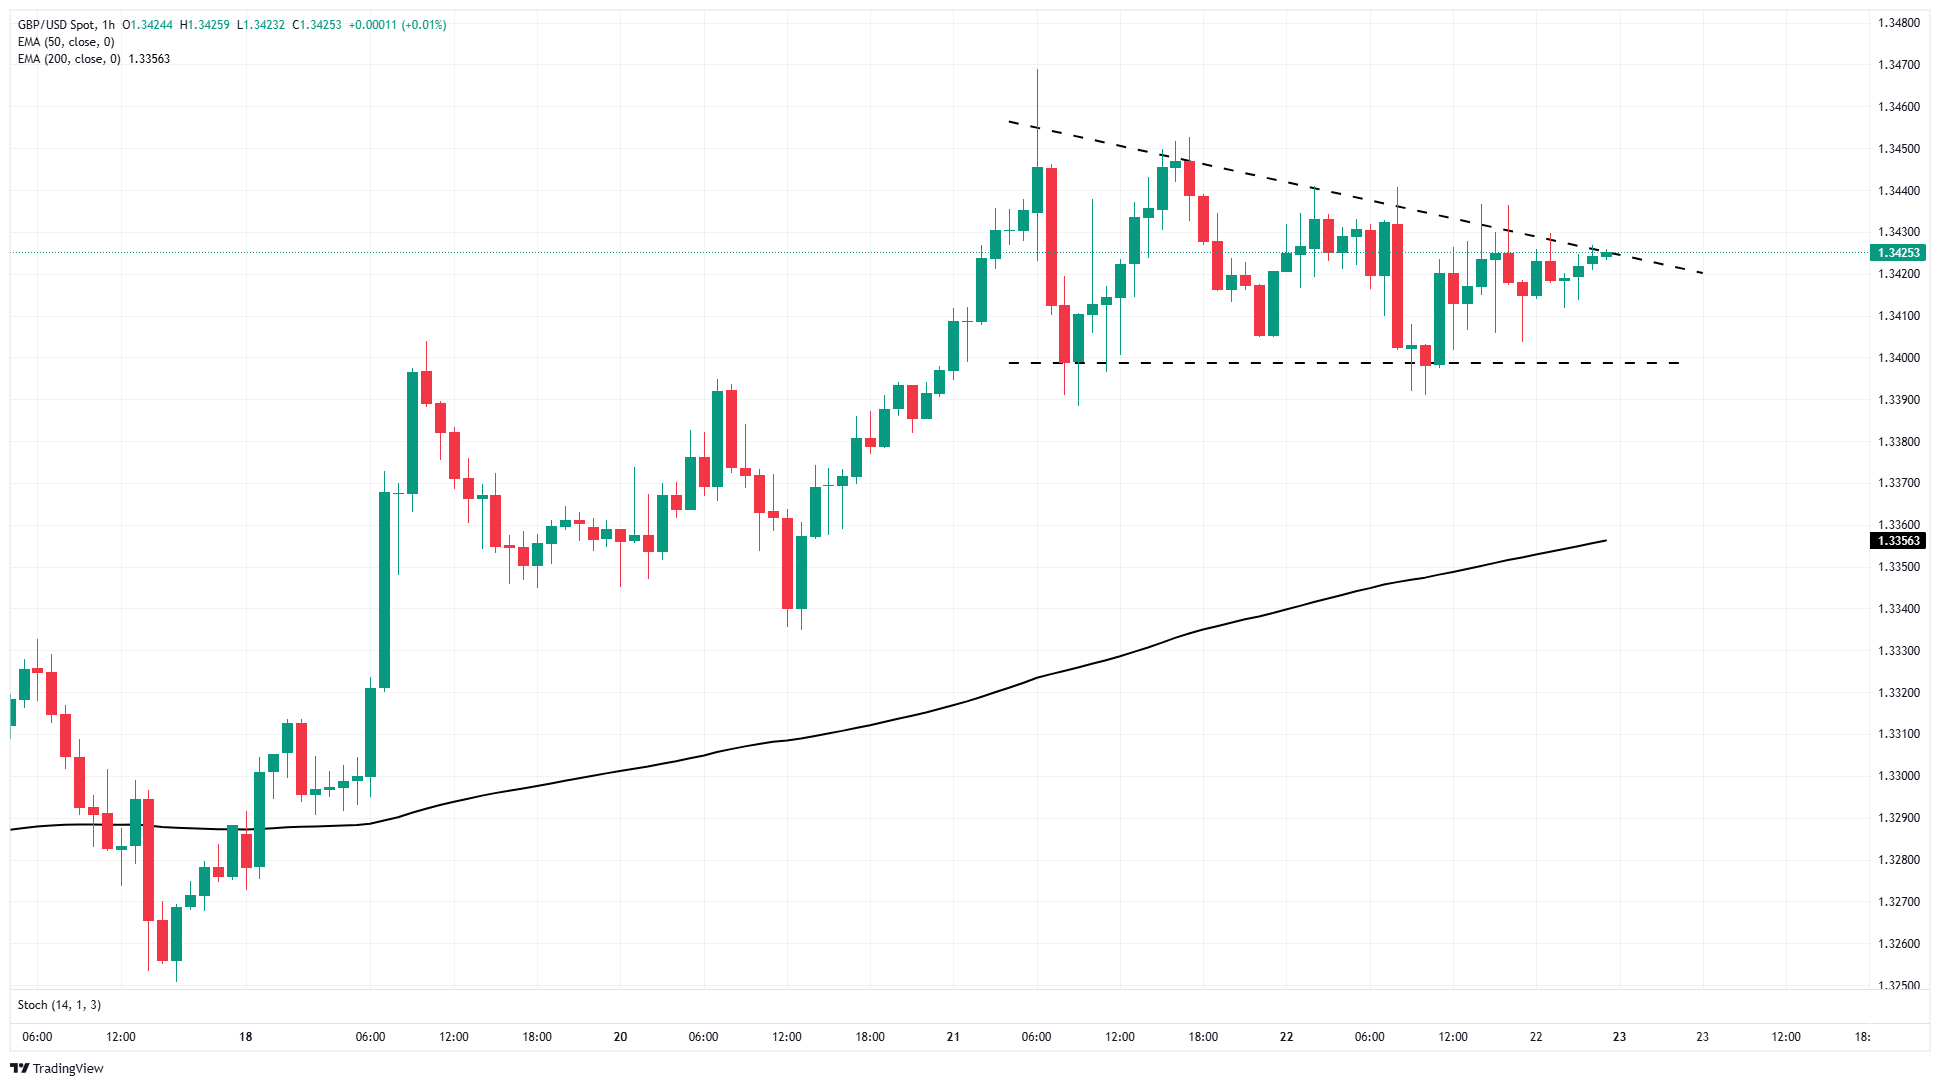
In the near-term, bullish momentum has drained out of the GBP/USD chart; intraday price action has been caught in a tight consolidation pattern, and although the pair appears poised for a bullish breakout, there may not be enough bidding powder remaining in the keg to muscle Cable prices back above 1.3440 before intraday prices fall back to the 200-hour Exponential Moving Average (EMA) near 1.3355.
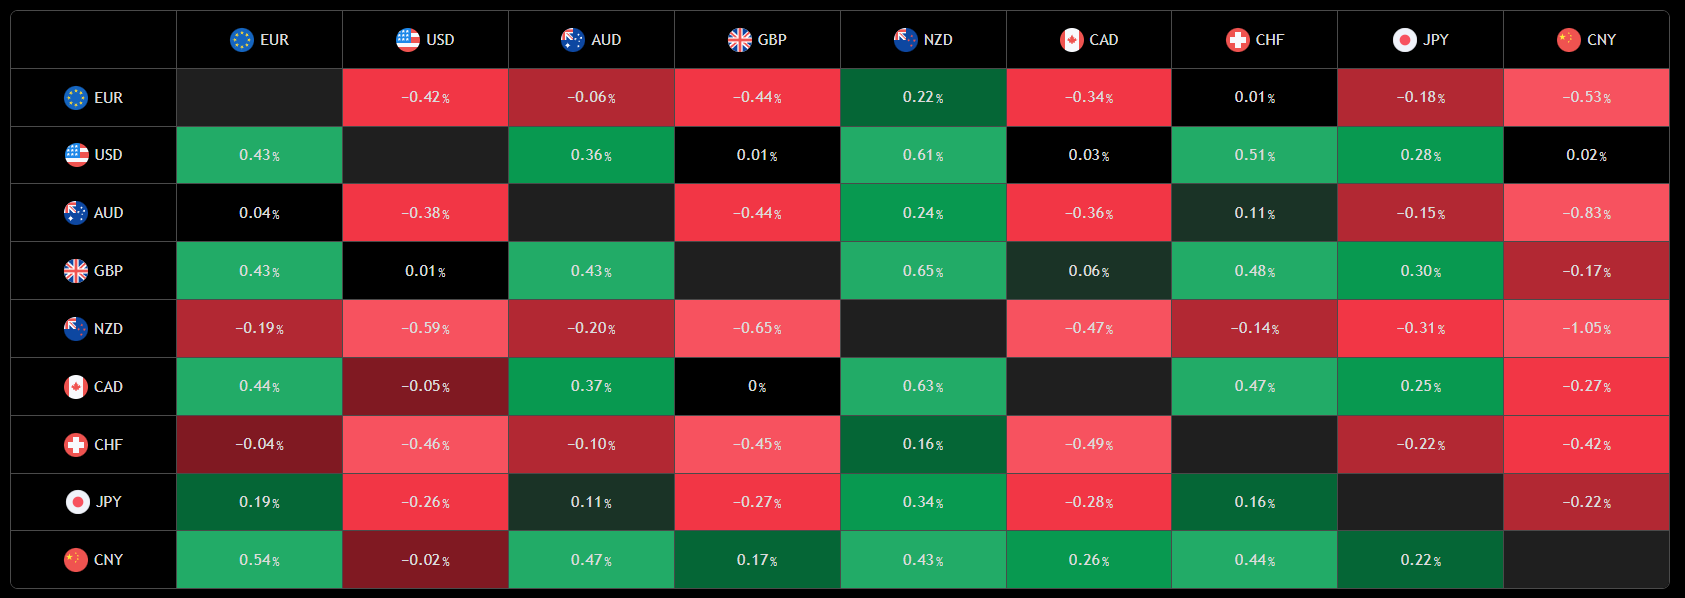
(TradingView currency heatmap, 1D timeframe)
GBP/USD daily chart
GBP/USD 1-hour chart
More By This Author:
EUR/USD Rises For A Third Straight Day As Greenback Weakness Takes HoldCanadian Dollar Rises As Greenback Withers On Wednesday
EUR/USD Climbs On Greenback Weakness, But Key Technical Barriers Remain In Place


