
GBP/USD Declines Steepens As Hotter CPI Bolsters Greenback
Photo by Colin Watts on Unsplash
- GBP/USD backslid for the eighth straight day on Tuesday.
- US CPI inflation rose in June, pushing down on Fed rate cut hopes.
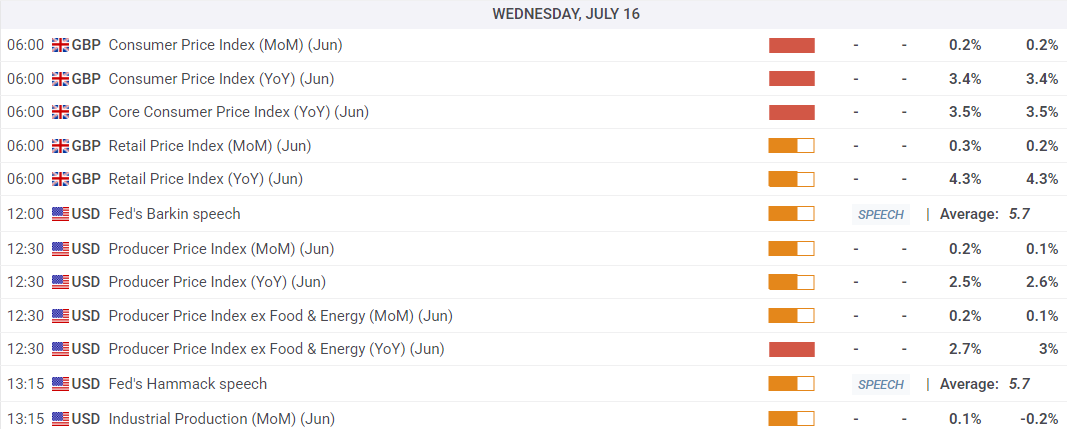
- Coming up on Wednesday: UK CPI inflation, US PPI business inflation.
GBP/USD shed weight for the eighth straight session on Tuesday. Global risk appetite soured after US Consumer Price Index (CPI) inflation rose in June, casting a long, tariff-fueld shadow over investors that were hoping for a quick pivot into fresh rate cuts from the Federal Reserve (Fed) in the third quarter.
US CPI inflation rose through the tail end of the second quarter. Despite the figures mostly keeping in line with or beating median forecasts, investors are still feeling the pressure from rising price pressures. Annualized headline CPI inflation rose to 2.7% YoY in June, moving in the opposite direction of the Fed policy target range of 2%. With inflation pressures still simmering away in the background, already-thin market hopes for an early rate cut from the Fed have evaporated.
Hello inflation, goodbye rate cuts
According to the CME’s FedWatch Tool, rate traders have fully priced in a rate hold at the Fed’s July rate meeting. Hopes for a September rate cut also got knocked back post-CPI, with 44% odds of a continued hold on rates on the books. Rate markets are still holding out for two cuts in 2025 despite still-warm inflation measures, with 80% odds of at least a quarter-point rate cut priced in for October.
Cable traders will have to buckle down for a second and third go around the inflation carousel on Wednesday: United Kingdom (UK) CPI inflation figures are due early in the London session, followed by further US inflation data from the Producer Price Index (PPI). A fresh batch of UK labor data is also due on Thursday, followed by US Retail Sales figures.
GBP/USD price forecast
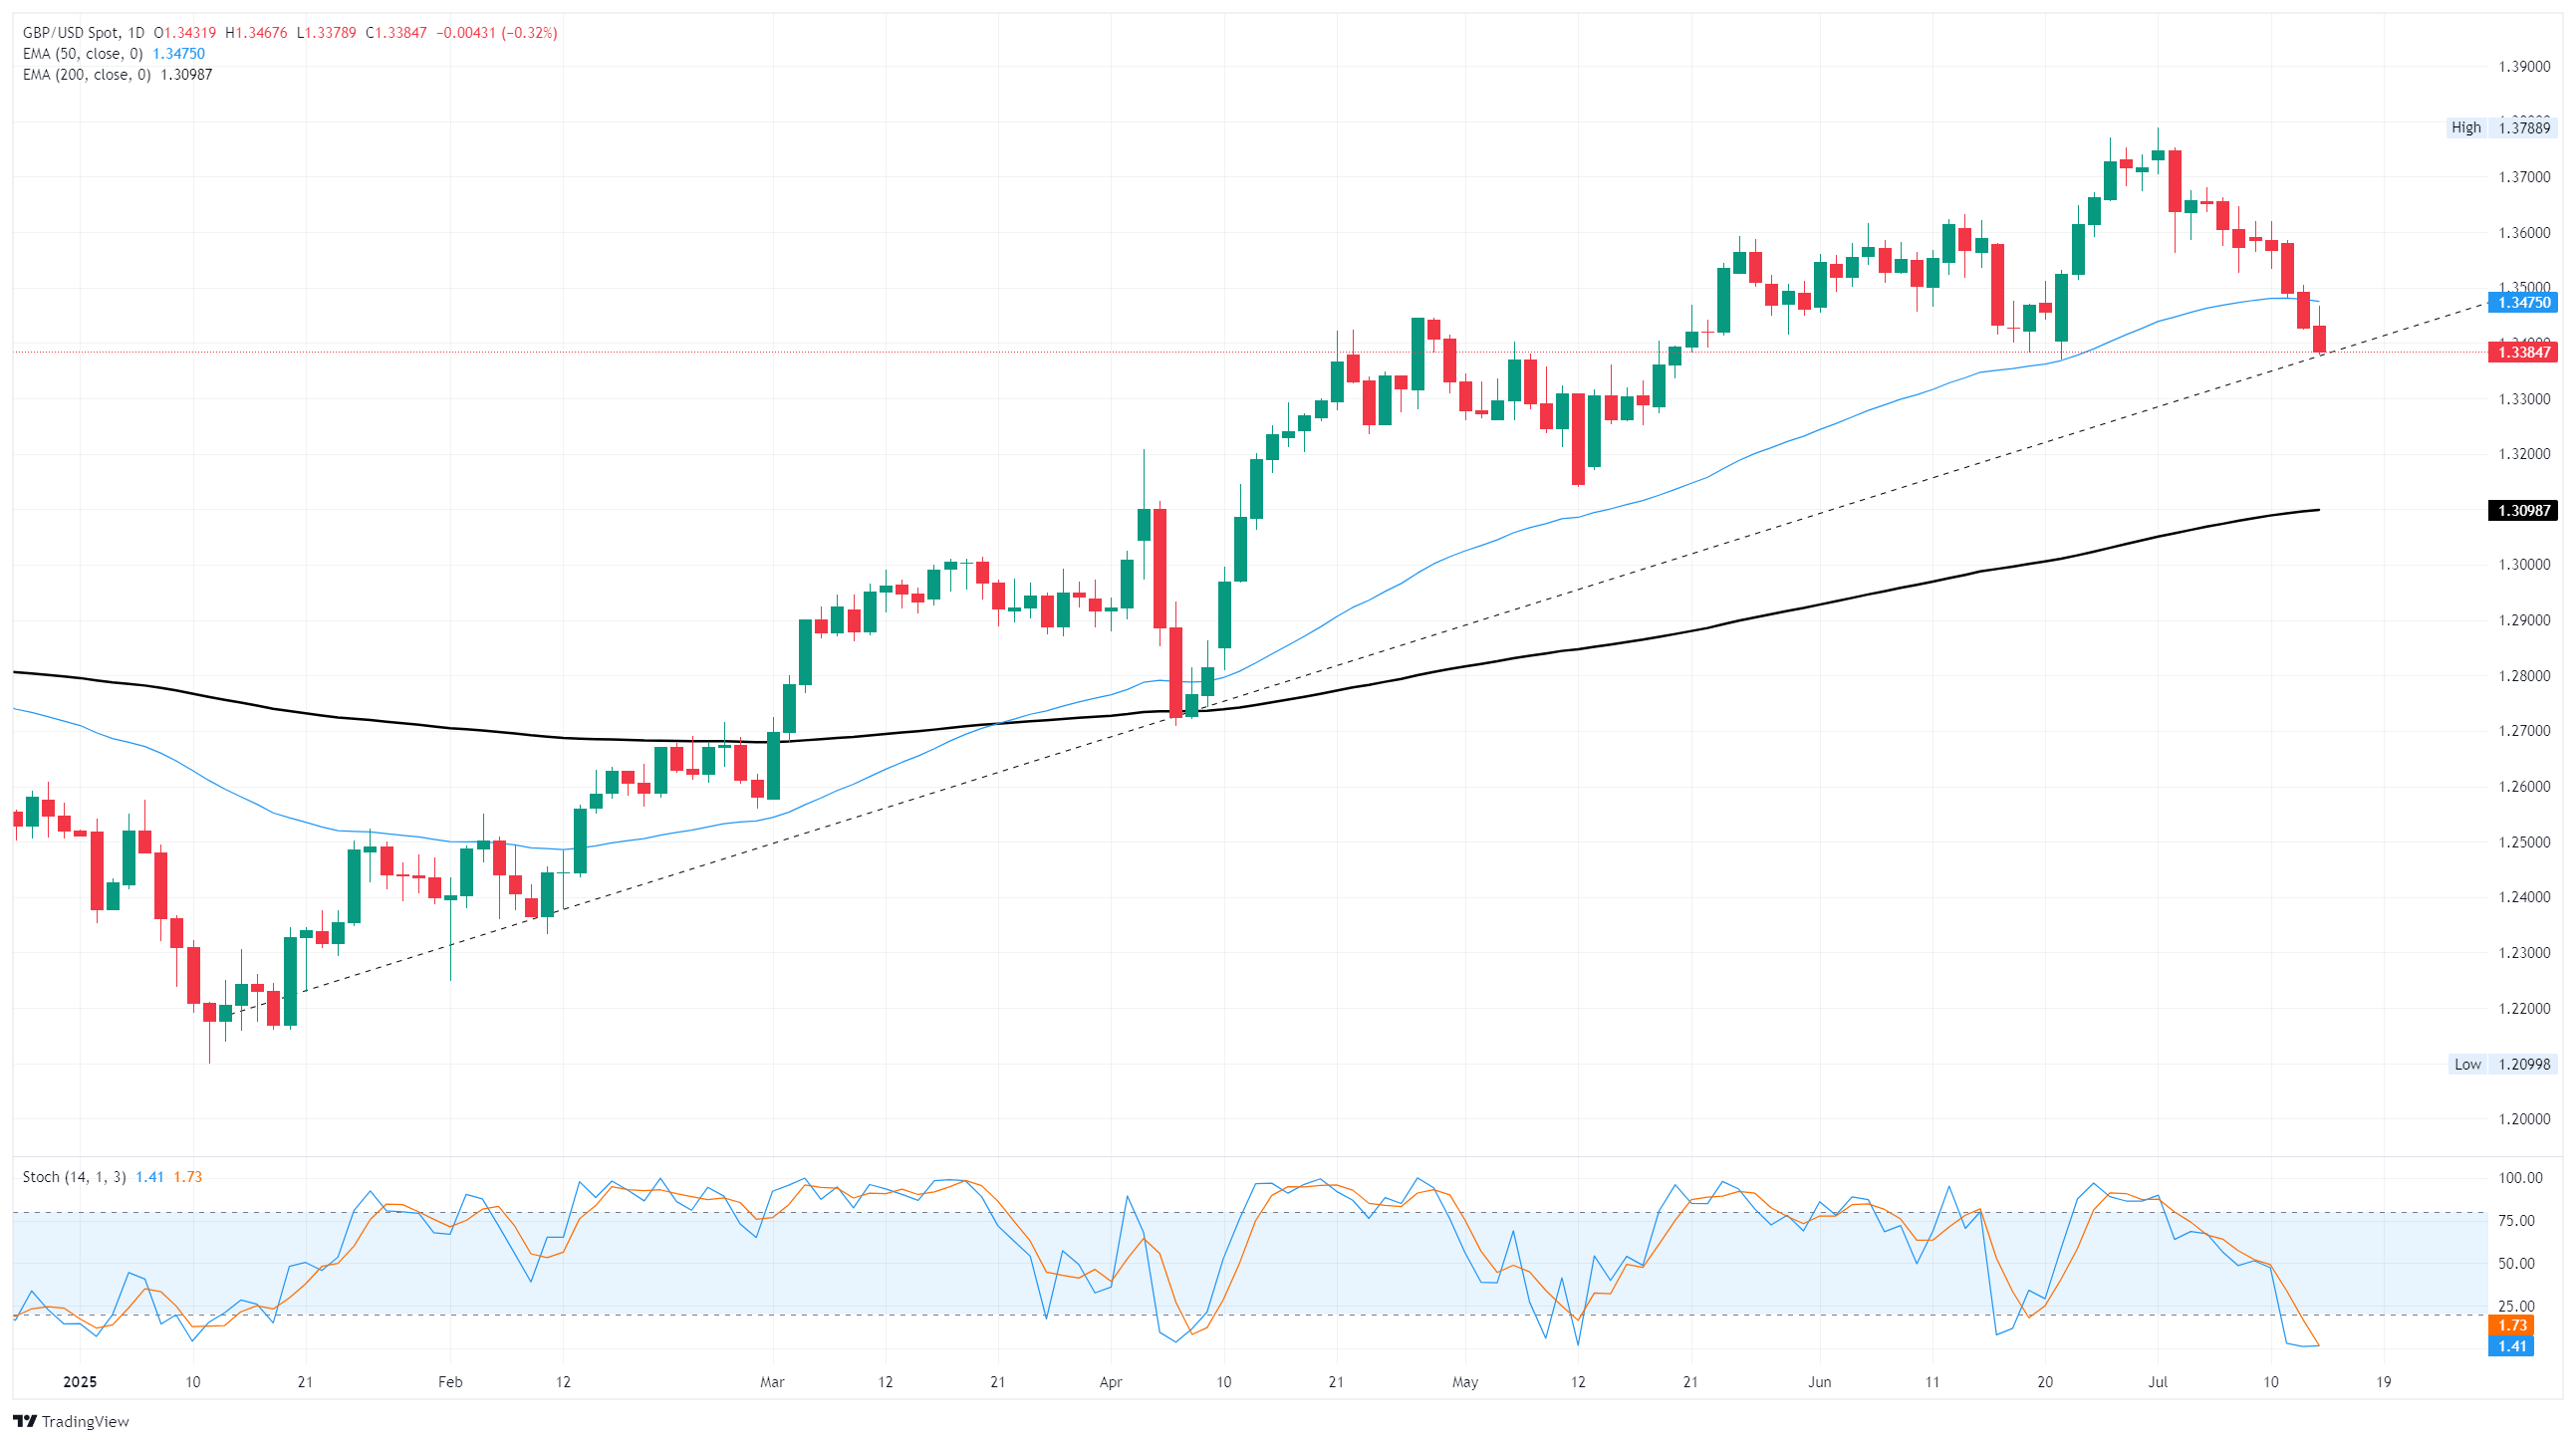
The Pound Sterling (GBP) has tumbled nearly 3% top-to-bottom against the US Dollar, falling from a multi-year high posted on the first day of July. The pair has backslid cleanly through the 50-day Exponential Moving Average (EMA) near 1.3500, and sustained selling pressure has Cable knocking on a rising trendline from January’s lows near 1.2200.
GBP/USD daily chart
More By This Author:
Dow Jones Industrial Average Holds As Investors Bank On Another Tariff DelayDow Jones Industrial Average Rides Out Tariff Volatility As Investors Bank On Another Walkback
Dow Jones Industrial Average Struggles As Equities Buckle Under New Tariff Threats


