GBP/JPY Sees Thin Rebound On Friday, Falls Just Short Of 182.00
Image Source: Unsplash
- The GBP/JPY catches a soft bid to challenge 182.00 after a week of stubborn losses.
- The Yen surged on the week, bolstered by a hawkish BoJ.
- The Guppy heads into next week’s central bank showdown on the low side.
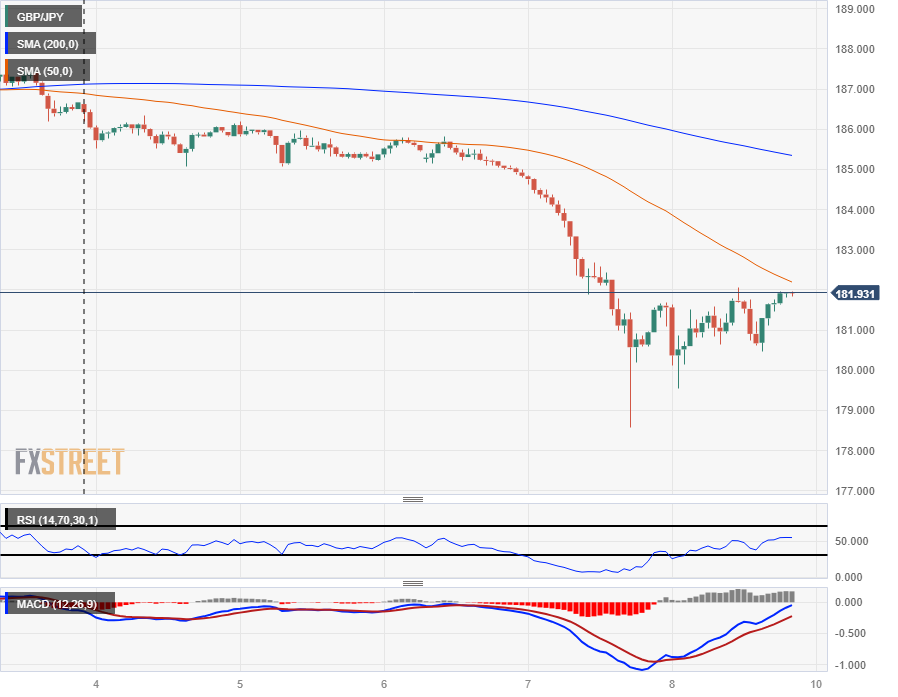
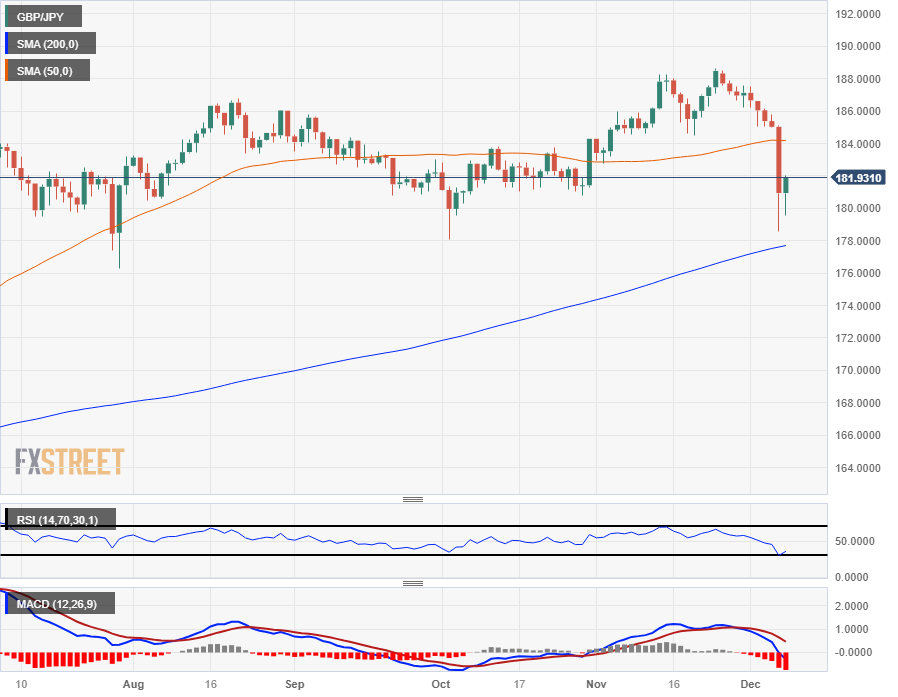
The GBP/JPY eked out a small gain on Friday, finishing the day up a slim tenth of a percent to cap off a trading week of firm declines. The Guppy ends the trading week down a firm two and a third percent from the week’s opening bids near 186.60, hitting a nine-week low of 178.58 amidst Thursday’s broad-market Yen rally.
The Bank of Japan (BoJ) kicked off a wild surge in the Japanese Yen after BoJ Governor Kazuo Ueda struck unusually hawkish tones in the mid-week, hinting that the BoJ could be on pace to begin tightening monetary policy, specifically highlighting the Japanese central bank’s negative rate regime.
Despite the BoJ fearing a collapse in Japanese inflation sometime in 2025, Japanese Core Consumer Price Index (CPI) inflation continues to run hotter than expected, hitting 2.9% for the year into October and chalking in a nineteenth straight consecutive month of inflation outrunning the BoJ's 2% upper target band.
Yen traders picked up the BoJ’s hawkish tone and ran with it, sending the JPY surging across the board. The GBP/JPY tumbled nearly three and a half percent top-to-bottom on Thursday, pushing the pair down into new lows below 178.60.
Next week sees UK labor figures, followed by Japanese manufacturing figures, culminating in 2023’s last rate call from the Bank of England (BoE).
GBP/JPY Technical Outlook
The GBP/JPY’s tumble left the pair knocking into fresh multi-week lows, and Friday’s thin rebound has the Guppy rebounding from the 180.00 major handle.
Near-term momentum still leans in favor of the bulls, with technical support coming from the still-untouched 200-day Simple Moving Average (SMA) near 178.00, but the last swing high into 188.66 represents a significant peak that bidders will struggle to retake.
The GBP/JPY is at risk of re-entering a consolidation phase around the 50-day SMA near the 184.00 price level, and short sellers will have their work cut out for them to try and cut the recovery rally short.
GBP/JPY Hourly Chart

GBP/JPY Daily Chart

GBP/JPY Technical Levels
GBP/JPY
| OVERVIEW | |
|---|---|
| Today last price | 181.93 |
| Today Daily Change | 0.99 |
| Today Daily Change % | 0.55 |
| Today daily open | 180.94 |
| TRENDS | |
|---|---|
| Daily SMA20 | 186.41 |
| Daily SMA50 | 184.19 |
| Daily SMA100 | 183.76 |
| Daily SMA200 | 177.61 |
| LEVELS | |
|---|---|
| Previous Daily High | 185.09 |
| Previous Daily Low | 178.59 |
| Previous Weekly High | 188.53 |
| Previous Weekly Low | 186.2 |
| Previous Monthly High | 188.67 |
| Previous Monthly Low | 182.75 |
| Daily Fibonacci 38.2% | 181.07 |
| Daily Fibonacci 61.8% | 182.61 |
| Daily Pivot Point S1 | 177.99 |
| Daily Pivot Point S2 | 175.04 |
| Daily Pivot Point S3 | 171.49 |
| Daily Pivot Point R1 | 184.49 |
| Daily Pivot Point R2 | 188.04 |
| Daily Pivot Point R3 | 191 |
More By This Author:
Crude Oil Sees A Bounce On Friday, Still Set For Another Down Week With WTI Below $72WTI Recovers Above $70.00 On Russia-saudi Joint Statement On Output Cuts
USD/JPY Drops On Its Worst Day In Over A Year, Breaches 142.00
Disclosure: Information on this article contains forward-looking statements that involve risks and uncertainties. Markets and instruments profiled on this page are for informational purposes ...
more


