

GBP/JPY is trying to pierce the trendline for the uptrend since the August lows. If it is successful and decisively breaches the trendline, it will suggest a follow-through lower to a fresh downside target at 186.20, the 61.8% Fibonacci of the down move prior to the trendline (blue rectangle on chart).
The pair is now in a short and probably medium-term downtrend (since the October 31 high) and according to technical analysis lore trends have a tendency to extend, suggesting the odds favor even more downside to come.
GBP/JPY Daily Chart
(Click on image to enlarge)
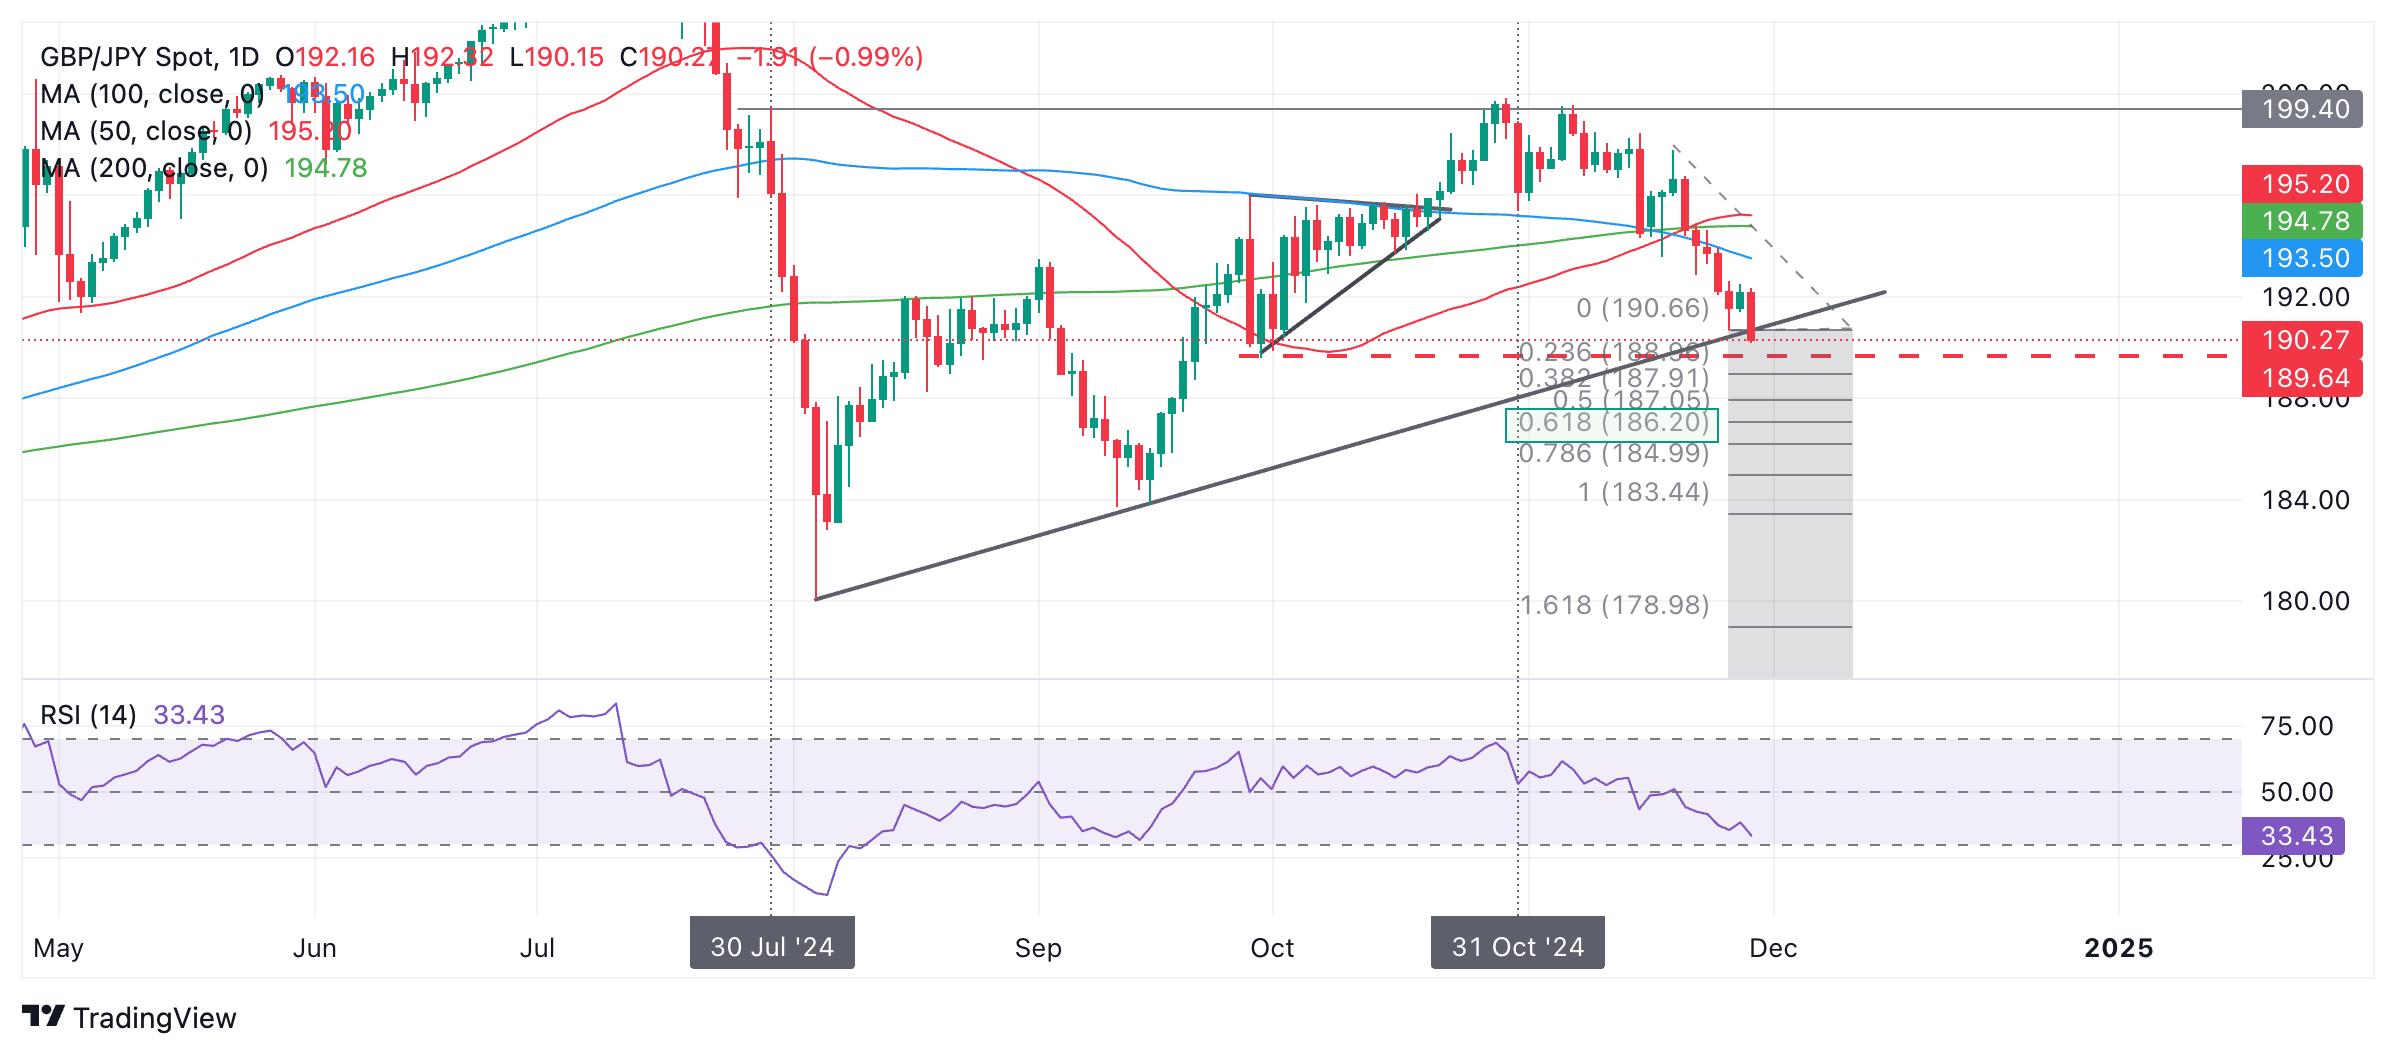
GBP/JPY is making its way down to the next target for the pair at around 189.56, the low of the Right-Angled triangle that formed in late September and early October.
It is also possible it could bounce from the current level at the trendline which is a support level.
The Relative Strength Index (RSI) is not yet oversold which indicates the pair could still have further to fall before it gets oversold.
A decisive breach of the trendline would be one accompanied by a long red candlestick that closed near its lows and well clear of the trendline, or three consecutive red candles that breached the level.
More By This Author:
USD/JPY Price Prediction: Breaks Out Of Price Pattern And DeclinesAUD/USD Holds Steady Above 0.6500, Lacks Bullish Conviction Amid Trade War Fears
Gold Price Pares Intraday Losses, Keeps The Red Amid Reviving USD Demand



Comments
Log in or sign up to join the conversation.