
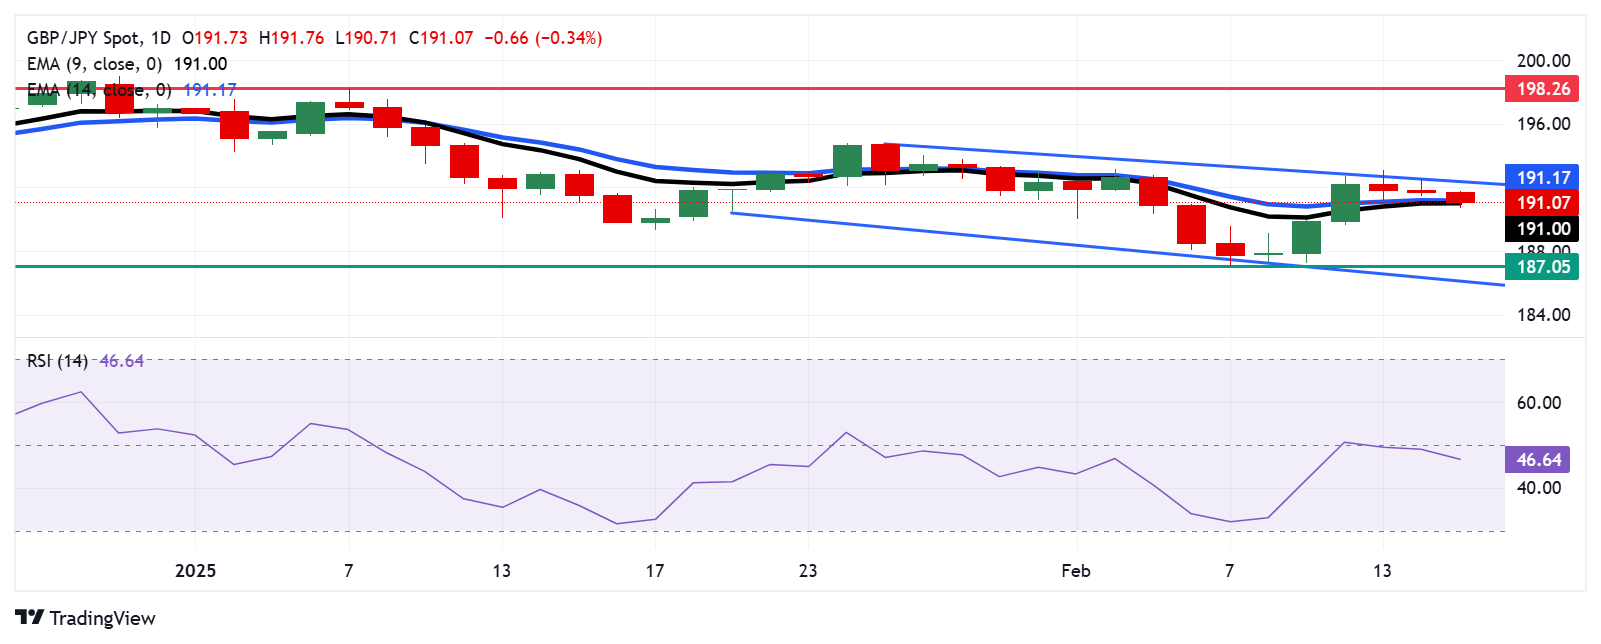
GBP/JPY continues its losing streak for the third consecutive session, trading around 191.00 during the European hours on Monday. An analysis of the daily chart showed the pair remains within the descending channel pattern, indicating a prevailing bearish bias.
Additionally, the 14-day Relative Strength Index (RSI), a key momentum indicator, falls below the 50 level, strengthening the bearish momentum. However, the GBP/JPY cross trades around the nine- and 14-day Exponential Moving Averages (EMAs), suggesting short-term price momentum is neutral.
Regarding its support, the nine-day EMA at the 191.00 level acts as immediate support for the GBP/JPy cross. A break below this level could weaken the short-term price momentum and lead the currency cross to navigate the region around a five-month low at 187.05, which was recorded on February 7, followed by the lower boundary of the descending channel around the psychological level of 186.00.
On the upside, the GBP/JPY cross could test immediate resistance at the 14-day EMA at 191.17. A break above these levels could weaken the bearish bias and support the pair to test the descending channel’s upper boundary at the 192.50 level.
GBP/JPY: Daily Chart
(Click on image to enlarge)
More By This Author:
US Dollar Index Price Forecast: Remains Near 107.00, Lower Descending Channel Boundary
WTI Rises To Near $71.50 Amid Increasing Fuel Demand
Australian Dollar Rises As Trump Delays Reciprocal Tariffs


Comments
Log in or sign up to join the conversation.