
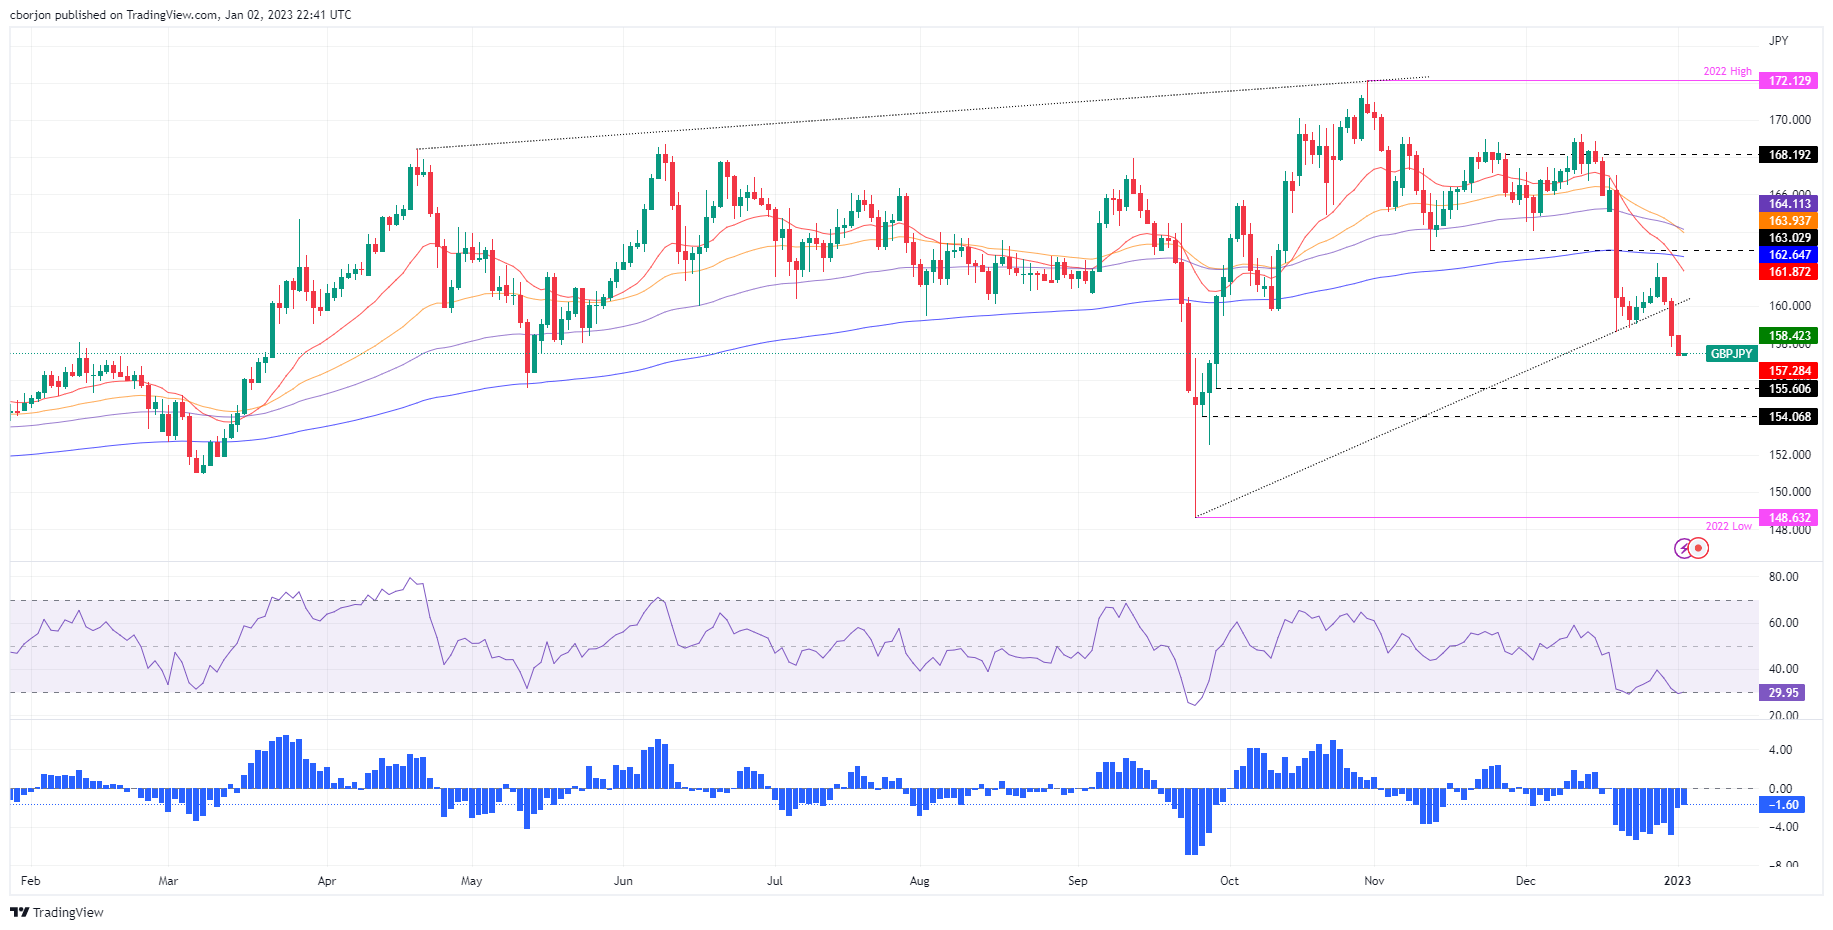
The GBP/JPY plunged more than 100 pips on Monday, extending its losses to three consecutive days, once price action dived below the 200-day Exponential Moving Average (EMA). Furthermore, the cross of the 20-day EMA beneath the 200-day EMA exacerbated the acceleration of the downtrend, as the GBP/JPY gets poised to fall toward the 155.00 mark. At the time of writing, the GBP/JPY is trading at 157.46, below its opening price by 0.69%.
GBP/JPY Price Analysis: Technical outlook
After clearing a three-month-old upslope support trendline drawn from September lows around 148.60s, the GBP/JPY fall increased its velocity. Last Thursday, the GBP/JPY formed a bearish engulfing candle pattern, followed by a tall red candle that cleared on its way south of the 160.00 figure and the previously mentioned trendline. Oscillators like the Relative Strength Index (RSI) entered oversold conditions, while the Rate of Change (RoC) shows that sellers remain gathering momentum. Therefore, the GBP/JPY might continue to fall further.
Therefore the GBP/JPY first support would be the September 29 daily low of 155.60, followed by the 155.00 mark, ahead of the September 27 swing low of 154.07.
As an alternate scenario, if GBP/JPY buyers reclaim 159.00, that could open the door to 160.00, close of the previously mentioned upslope trendline, which would be resistance, ahead of the 20-day EMA at 161.86.
(Click on image to enlarge)
GBP/JPY Key Technical Levels
GBP/JPY
| OVERVIEW | |
|---|---|
| Today last price | 157.56 |
| Today Daily Change | -1.14 |
| Today Daily Change % | -0.72 |
| Today daily open | 158.7 |
| TRENDS | |
|---|---|
| Daily SMA20 | 164.03 |
| Daily SMA50 | 166.02 |
| Daily SMA100 | 164.47 |
| Daily SMA200 | 163.76 |
| LEVELS | |
|---|---|
| Previous Daily High | 160.53 |
| Previous Daily Low | 157.84 |
| Previous Weekly High | 162.34 |
| Previous Weekly Low | 157.84 |
| Previous Monthly High | 169.28 |
| Previous Monthly Low | 157.84 |
| Daily Fibonacci 38.2% | 158.87 |
| Daily Fibonacci 61.8% | 159.51 |
| Daily Pivot Point S1 | 157.52 |
| Daily Pivot Point S2 | 156.33 |
| Daily Pivot Point S3 | 154.82 |
| Daily Pivot Point R1 | 160.21 |
| Daily Pivot Point R2 | 161.72 |
| Daily Pivot Point R3 | 162.9 |
More By This Author:
EUR/USD Struggles Around The Two-Week High Of 1.0700, Tumbles To 1.0650AUD/USD Rises To Test Last Week's Highs Near 0.6820
USD/CHF To Display Rangebound Auction Around 0.9250 Ahead Of Swiss Inflation


Comments
Log in or sign up to join the conversation.