
GBP/CAD has broken out of a bearish Rising Wedge pattern and started to decline. Although it is pulling back at the moment, it is expected to eventually continue falling towards the pattern’s downside targets.
GBP/CAD Daily Chart
(Click on image to enlarge)
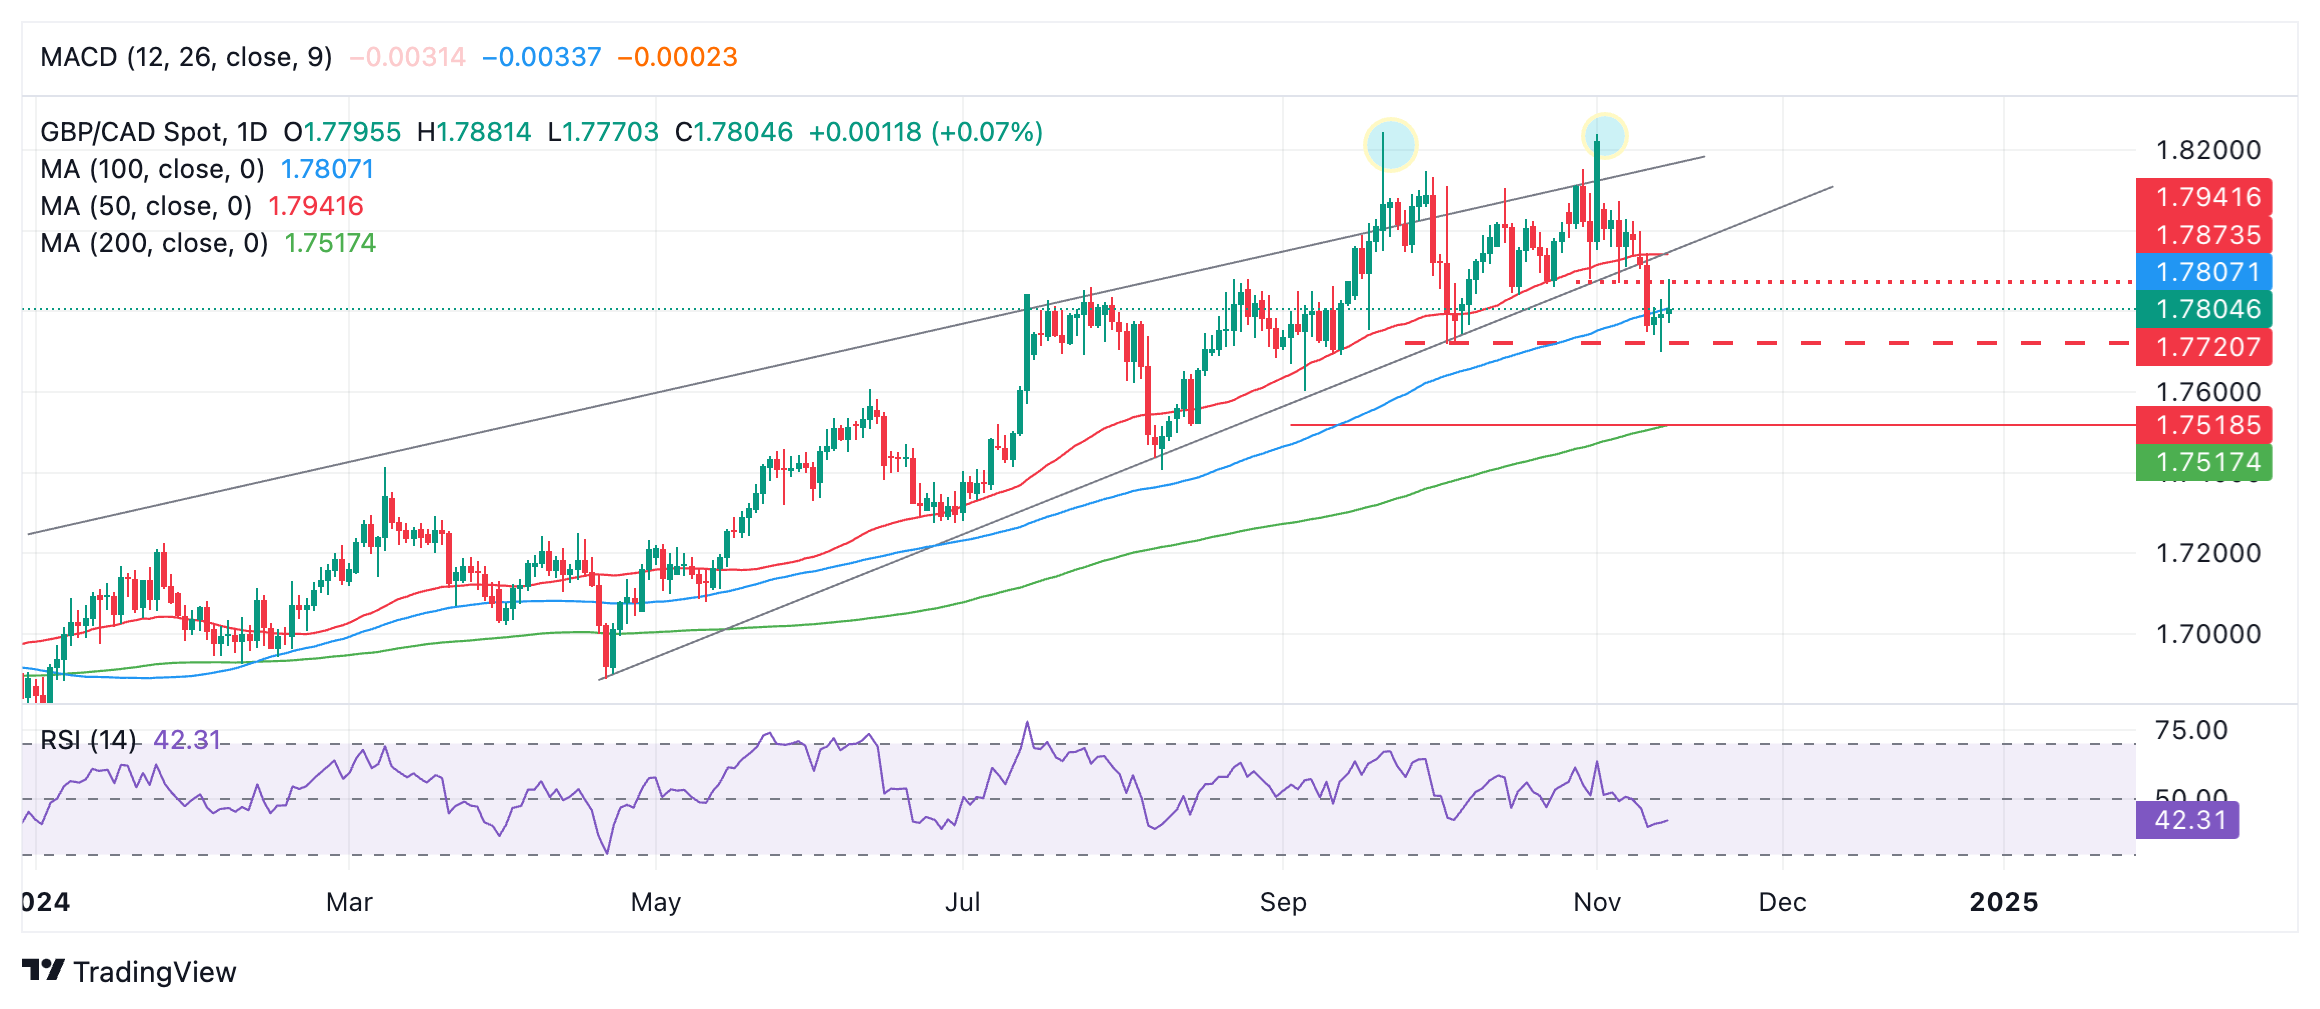
A break below the 1.7700 November 14 low would probably confirm further weakness to the next target at 1.7518, the 61.8% extrapolation of the width of the Rising Wedge at its widest part extrapolated lower. This is the usual technical method for forecasting breakouts.
Prior to the breakdown, GBP/CAD broke temporarily above the upper guardrail of the Rising Wedge pattern on several occasions (blue circles on chart) on September 20 and November 1. This is a sign of bullish exhaustion and an early warning of impending reversal.
More By This Author:
GBP/JPY Declines As Stronger Growth Data From Japan Lifts The Yen
Gold Stabilizes After Bouncing Off 100-Day Moving Average
USD/CHF Price Prediction: Breaks Above 200-Day SMA And Continues Higher


Comments
Log in or sign up to join the conversation.