Forex Forecast: Pairs In Focus - Sunday, Feb. 13
The difference between success and failure in Forex trading is likely to depend upon which currency pairs you choose to trade each week and in which direction, and not on the exact trading methods you might use to determine trade entries and exits.
When starting the trading week, it is a good idea to look at the big picture of what is developing in the market as a whole and how such developments are affected by macro fundamentals and market sentiment.
The Forex/CFD market is currently showing some strong trends, so it may be a good time to be looking at trading Forex.
Big Picture for Sunday, Feb. 13, 2022
Risk sentiment soured slightly over the week in the US, with several major global stock market indices ending the week lower. The Forex market saw the US dollar move little, but several energy and soft commodities (WTI crude oil, gasoline, soybeans, and corn) climbed to reach new long-term highs. The euro was the biggest loser of the week in the Forex market, while the Australian dollar strengthened the most of all major currencies.
Last week’s Forex market was dominated by US inflation reaching an annualized rate of 7.5%, its highest level since 1982, exceeding the consensus forecast of 7.3%. Last week was the third consecutive week in which the number of new global confirmed coronavirus cases fell.
I wrote in my previous piece last week that the best trades for the week were likely to be long of WTI crude oil and soybeans. This was a good and profitable call, as the Teucrium Soybeans ETF (SOYB) increased by 1.5% over the week, while WTI crude oil ended the week higher by 2.1%. This gave an averaged profit of 1.8% for the week.
Fundamental Analysis & Market Sentiment
The headline takeaways from last week were the continuing increase in the US inflation rate and the increasing prospect of war in Ukraine. Several countries are recommending evacuation of their nationals from Ukraine and many analysts see war as increasingly likely to begin soon.
This is causing some risk-off sentiment and may be boosting the prices of commodities, especially energies. Commodities tend to perform well in high-inflation environments such as what we are experiencing now.
The coming week is likely to see a higher or maybe similar level of volatility compared to last week, with markets seeing strong commodities, especially in energies and agriculture, under an overlying theme of high inflation and negative real interest rates. There are several economic data releases due this week, in order of importance:
- FOMC Meeting Minutes.
- British CPI (inflation).
- Reserve Bank of Australia Meeting Minutes.
- Canadian CPI (inflation).
- US Retail Sales.
- US PPI.
- Australian Unemployment.
Last week saw the global number of confirmed new coronavirus cases fall again. Approximately 61.7% of the global population has now received at least one vaccination.
Technical Analysis - U.S. Dollar Index
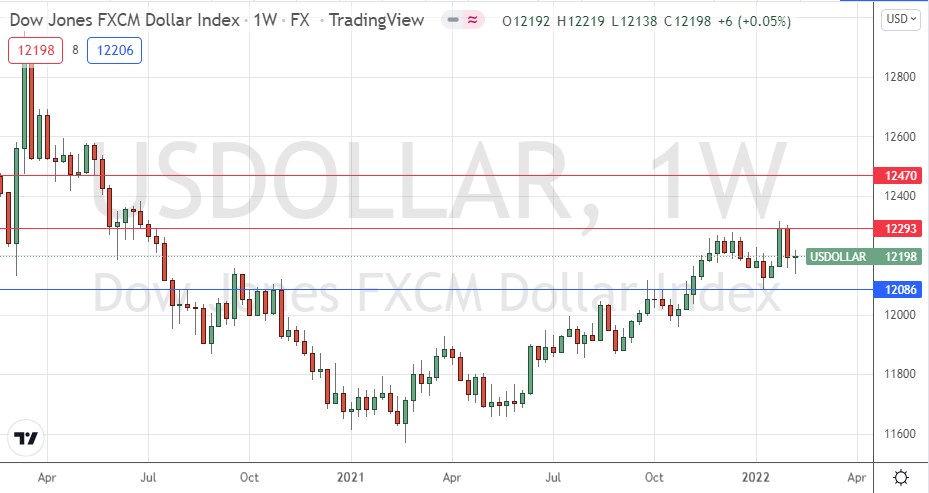
The weekly price chart below shows the U.S. Dollar Index printed a small bullish pin bar last week, as the price continued its consolidation between the support level at 12086 and the resistance level at 12293. The price is obviously consolidating, but there is still a long-term bullish trend in force, with the price higher than where it was three and six months ago.
If the support level at 12086 continues to hold, the long-term bullish trend will be likely to resume. Overall, it seems clear we still see a bullish picture in the US dollar over the long- and medium-terms, but in the Forex market the greenback may not be the main driver of prices right now. It may be a better time to trade currency crosses not involving the US dollar.
WTI Crude Oil
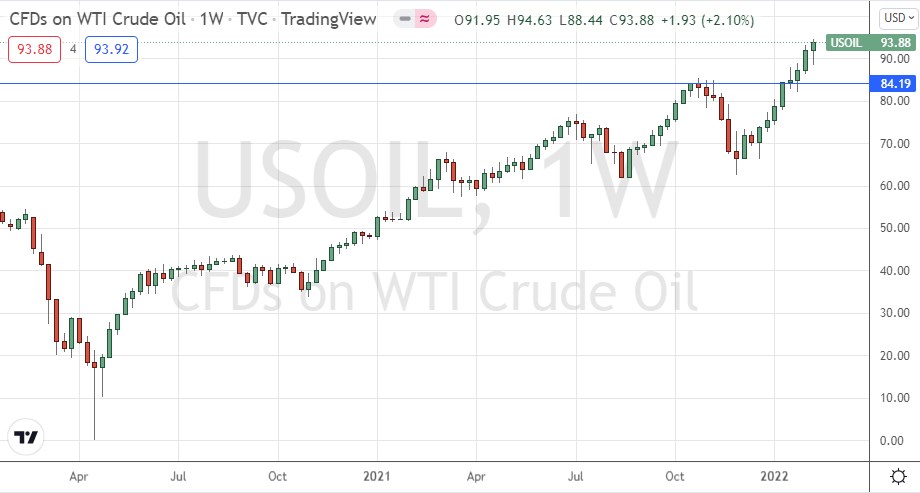
For the fifth week running, WTI crude oil made its highest weekly close in seven years last week, and it printed a relatively large bullish candlestick which looks healthy, closing near to the high of its price range. This suggests a further rise to come, with the price perhaps being boosted by fears of war between Russia and Ukraine. There are bullish signs, and I continue to see WTI crude oil as an interesting buy.
Soybeans
The prices of several agricultural “soft” commodities have been rising strongly in recent weeks, arguably driven by higher inflation rates and negative real rates of interest which we are seeing across many countries.
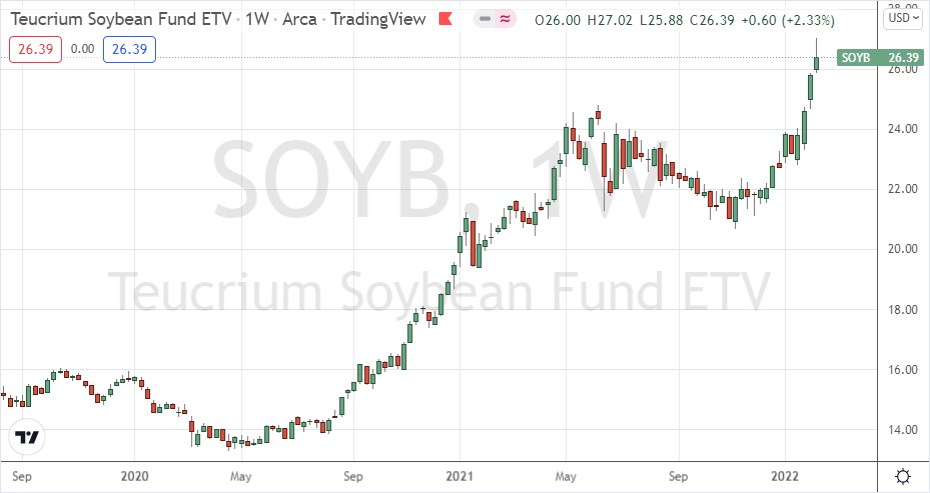
Last week’s price rise ended with the highest weekly close in seven years. It makes sense to look for long commodity trades during this period of high inflation, although be aware that volatility of soft commodities can be very high, so it is important to trade these in relatively small position sizes.
I see soybeans as an interesting buy if the ETF can make a daily close this week above $26.87.
Corn
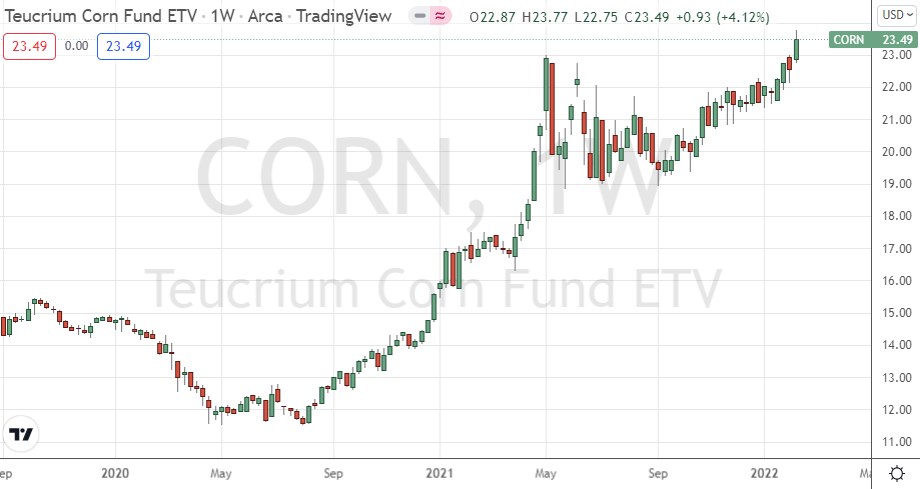
Along with soybeans, corn rose in price last week, but even more firmly. Last week’s strong price rise ended with the highest weekly close in five years, and the price ended the week not far off the high of the week’s price range.
I see corn as an interesting buy right now, as commodities that are relatively inelastic like foodstuffs tend to do well in high-inflation environments, such as what we see today.
Bottom Line
I see the best opportunities in the financial markets this week as likely to be long of WTI crude oil corn. Additionally, I see an opportunity in soybeans given a close above $26.87.
Disclosure: DailyForex will not be held liable for any loss or damage resulting from reliance on the information contained within this website including market news, analysis, trading signals ...
more


