Explaining The Moves In The Gold Price
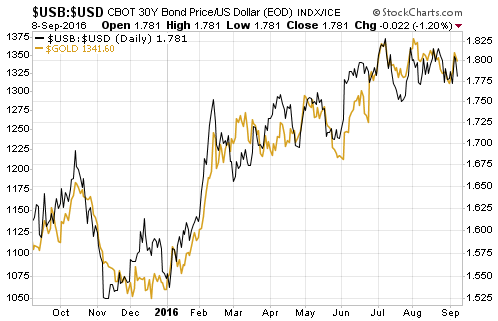
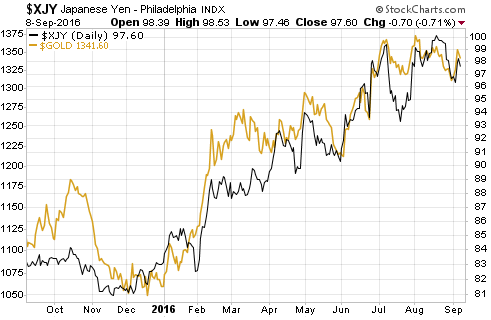
If you read some gold-focused web sites you could come away with the belief that movements in the gold price are almost completely random, depending more on the whims/abilities of evil manipulators and the news of the day than on genuine fundamental drivers. The following two charts can be viewed as cures for this wrongheaded belief.
The first chart compares the performance of the US$ gold price with the performance of the bond/dollar ratio (the T-Bond price divided by the Dollar Index). The charts are almost identical, which means that the gold price has been moving in line with a quantity that takes into account changes in interest rates, inflation expectations and currency exchange rates. The second chart shows that the US$ gold price has had a strong positive correlation with the Yen/US$ exchange rate. As we’ve explained in the past, gold tends to have a stronger relationship with the Yen than with any other currency because the Yen carry trade makes the Yen behave like a safe haven.


There are two possible explanations for the relationships depicted above. One is that the currency and bond markets, both of which are orders of magnitude bigger than the gold market, are being manipulated in a way that is designed to conceal the manipulation of a market that hardly anyone cares about. The other is that the gold price generally does what it should do given the performances of other financial markets. Only one of these explanations makes sense.
Disclosure: None


Or a third option.. that all paper markets are manipulated together for the same reason - to line the pockets of those performing the manipulation at the expense of everyone else.
If we had a true barometer of the physical gold commodity market, then we could make the distinction between real gold and other markets. But, your price chart is based upon the paper gold market which can be as easily manipulated as the others while having nothing to do with the fundamentals of the underlying real commodity.