
Evergrande
Four years ago, Grant published an article on China Evergrande and its ever rising price on the Hong Kong stock exchange. Evergrande's board of directors in 2016 earned $46 million. The article warned that a crash was coming. Today, the company is one of the most indebted companies, with up to $300 billion in debt at risk of default. James Grant is a financial expert and author of nine books. He published "Grant's", which is required reading by many investors.
On WealthTrack, Grant argued that Evergrande was massively overleveraged and diversified. The company focused on building condo buildings, many of which remained empty. The company reflected the Chinese broader economy, which is massively leveraged. Chinese banking assets represent about 53% of the world GDP in the past few years. Twenty-two percent of Chinese real estate is not occupied. Evergrande is just a representative of the overleveraging in the Chinese economy. The Chinese economy is driven by real estate speculation, which feeds the government tax base. Grant argues that Evergrande's collapse will have broad implications because it reflects the real estate speculative model that operates in China.
Source: Dianomi
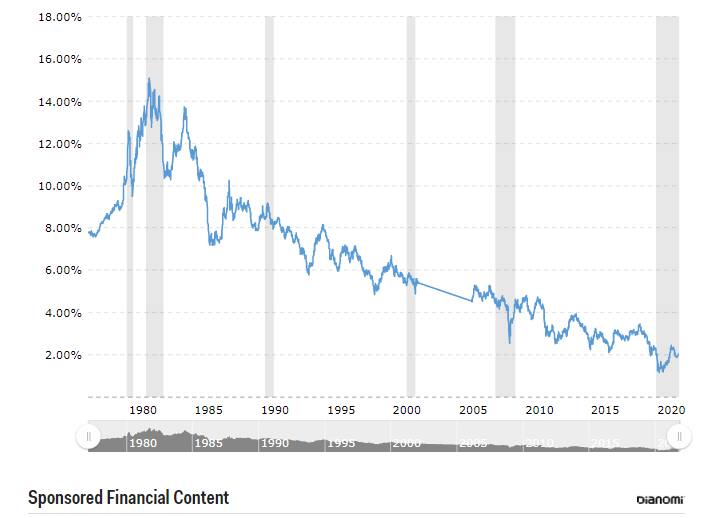
Bond Yields 40 Year Cycle
Bond yields have been declining for 40 years and the US dollar has been decoupled from gold since 1971. The economy has been flooded with paper money, borrowing is easy and interest rates are extremely low, making it seem you can accumulate debt with no worries. The more debt we see, the better it has become for bond holders. In about 1981, the US reached a trillion in sovereign debt, and now it is about $27 trillion in gross debt. Over that same time, interest rates have fallen from 15% to 1%, so it is extremely confusing why that has happened. Huge debt appears to be fine, until the holders of that debt decline to roll over the debt and buy more debt. Or until the borrowers can no longer pay the debt payments, such as if interest rates rise. The ten year note has gone up about 20 basis points, which seems like nothing but has rattled many people. Inflation appears to be more persistent than transitory.
The Fed appears to be under the impression that it is in charge of events, Grant said. However, Grant said, events are going to be more in charge of the Fed. On Wall Street, there is a generation gap between those who remember 1970s inflation, which began in 1965 with a jump from 1% to 2% or 3%, and those who do not remember such times. We had none of the debt and crises we have now, yet inflation began then and persisted for more than a decade. Younger people have seen nothing but falling rates and no inflation, so they have difficulty understanding that rates and inflation may rise.
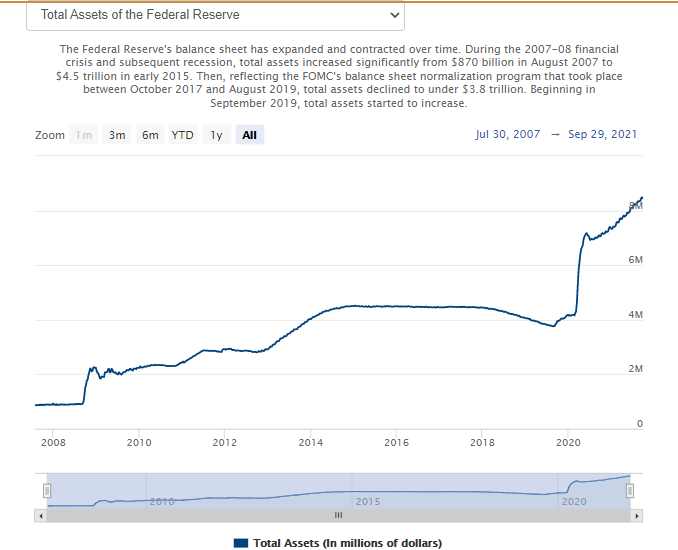
Fed's Balance Sheet Exploding Exponentially
The Fed is doubling its balance sheet every 18 months. The Treasury basically paying people not to work, Grant argues, will lead to inflation and higher interest rates.
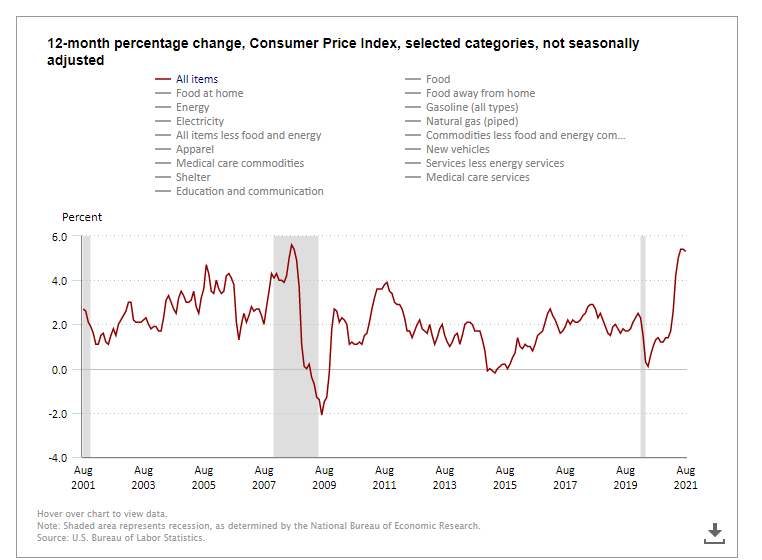
Real Inflation Is Upon Us
The true measure of inflation is a moral issue. Grant argues that inflation is a form of theft and unlegislated taxation. There is also an intuitive factor; the feeling that there are too many dollars out there. Inflation soaks up unwanted dollars that can't find any demand for them. Statistically, the CPI, shows another aspect of inflation. About 30% of the CPI is housing, but that is housing costs, not just real estate prices. Publicly, our government continues to print money and leverage assets more and more with no conception of the possible long-term damage that it could be causing. This is a new time with such a philosophy driving the Fed and the Treasury Department.
Inflation is the biggest risk for your wealth. Interest rates are key to determining the returns on every asset. Interest rates are suppressed by Central Bank policies. Therefore, everything you own hangs on the lowest interest rates in 4,000 years. If inflation persists and the Fed raises rates, which triggers a falling stock market--then what? No one knows, since the Fed has a low acceptance for a falling stock market. At some point, the Fed will not be able to control inflation and interest rates. Events will take over.
Inverted Fundamentals
Grant says that gold is up 50 times in 50 years. You should not compare it to stocks, since it is a store of value, not an investment for returns. Grant owns a lot of gold, enough of it. Of all the commodities, gold appears to be the least responsive to the economic situation. It is very hard to understand. Cryptocurrencies may be taking some of the air out of the gold market. There is probably going to be a better cryptocurrency invented compared to the one you own, so it is probably not one to hold for the very long term. Gold, however, is not going to be improved upon. Gold is underperforming. It is an investment, Grant says, in "monetary disorder," of which we have a lot.
The markets continue not to be matching the fundamentals. We have a number of black swans, such as the China Evergrande risk of default on billions in loans. Now we have news that another development company, Fantasia, in China has defaulted on its loans. We appear to be seeing the beginning of a possible domino effect in real estate developers in China. The key is whether the effect of these defaults will spread globally or remain confined to China and its highly leveraged real estate market and economy.
At the same time, we are negotiating the debt ceiling for the US government. The ceiling must be raised. There is no question about it. The pandemic continues and supply shortages continue to constrain the economy. Interest rates continue to be under close observation. The Fed may raise interest rates, which is causing jitters in the markets. Crude oil is shooting up and some analysts are suggesting it may top $100 a barrel.
Since the fundamentals seem so skewed, with gold and silver not rising rapidly with such negative fundamentals, we rely on the technicals to trade. We have never had such debt, interest rate worries, a pandemic, this level of stimulus, inflation worries, and supply shortages--all of which suggest that gold and silver should be rocketing upward.
Quantitative Analysis
Our Robo-Advisor, Nikki the Robot, produced weekly Bitcoin, gold and silver reports for this week based on our proprietary artificial intelligence algorithm, the Variable Changing Price Momentum Indicator (VC PMI).
Bitcoin
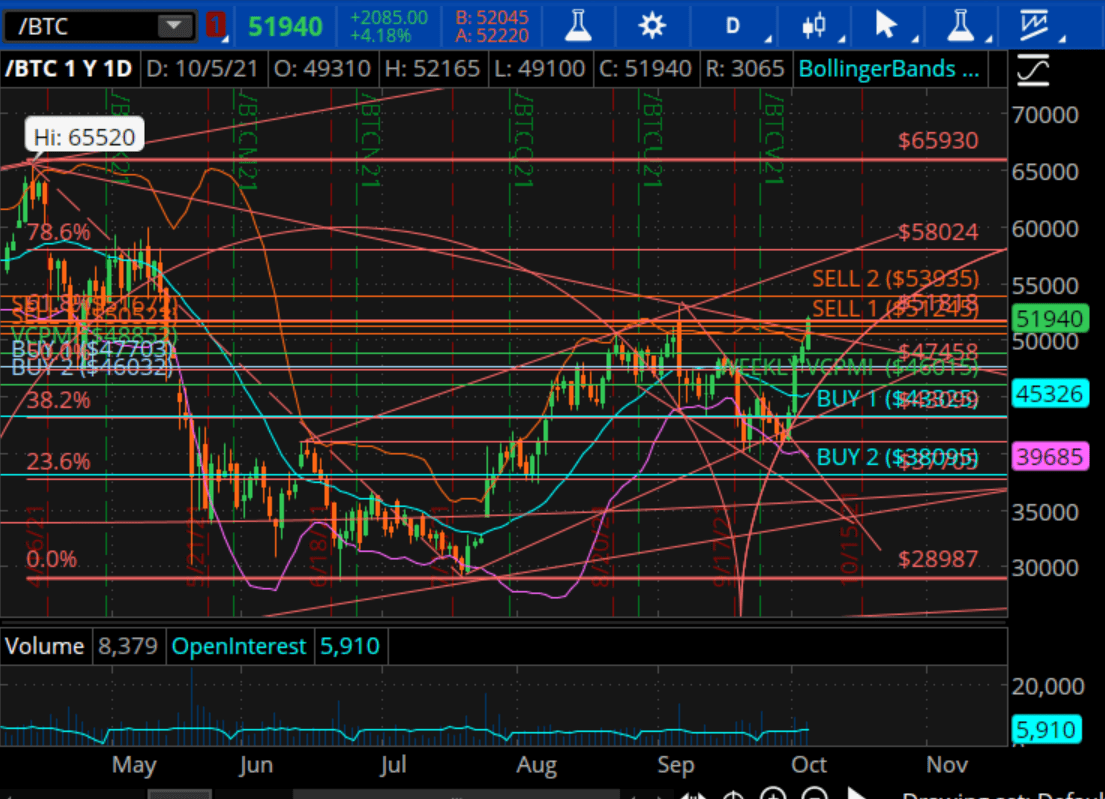
Courtesy: ema2trade.com
For Bitcoin, this week of October 1, 2021, the weekly trend momentum of 46,785 is bullish. The weekly VC PMI price momentum of 46,015 is bullish. A close below 46,015 stop would negate this bullishness to neutral. If you're long, take profits at the VC PMI Sell 1 level of 51,245 and the Sell 2 level of 53,935 this week. For shorts, exit at the Buy 1 level of 43,325 and Buy 2 at 38,095. The Bitcoin average price for this week is at 46,015.
Our Equity Management Academy CEO, Patrick MontesDeOca, said:
We are making new highs in Bitcoin with a new target of 51,245. We have been long and recommend that our subscribers go long the market weeks ago.
Silver

Courtesy: ema2trade.com
We are into a daily Buy level at $22.40. Right below it, we have $22.38, which is the average price.
"We are stabbing into an area of major support," MontesDeOca said.
Nikki the Robot said, for the weekly silver report, that the weekly trend momentum of $23.31 is bearish, while the weekly price momentum of $22.28 is bullish. A close below $22.28 stop, would negate the bullishness to neutral. If you're long, take profits at the Sell 1 level of $23.15 and the Sell 2 of $23.74. Exit shorts at the Buy 1 level of $21.70 and Buy 2 of $20.83.
"We have a buy trigger in silver from the daily Buy 2 level of $22.40," MontesDeOca said.
Gold
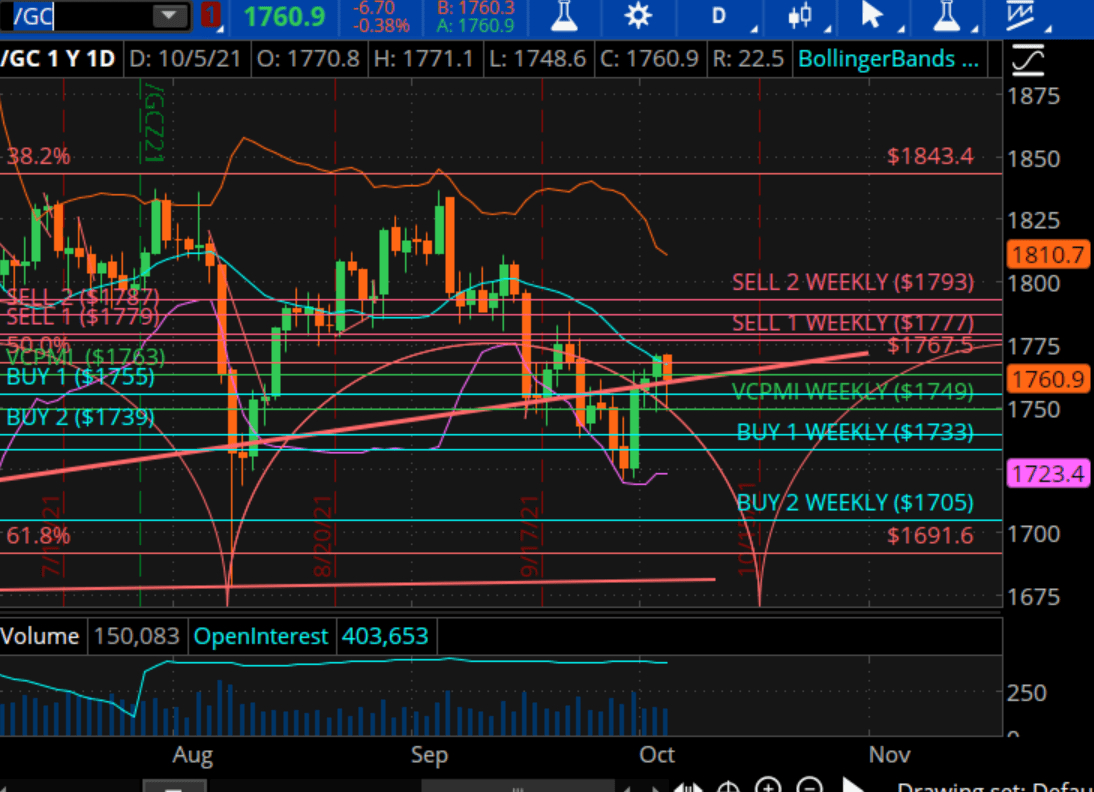
Courtesy: ema2trade.com
Nikki the Robot's weekly gold report said that the weekly trend momentum of $1783 is bearish. The weekly price momentum of $1749 is bullish. A close below $1749 stop will negate this bullishness to neutral. If you're short, take profits at the VC PMI Buy 1 level of $1733 and the Buy 2 level of $1705. Look to go long from those levels. If you're long, take profits at the Sell 1 level of $1777 and the Sell 2 level of $1793.
The daily VC PMI Buy 1 level is at $1755 and the Buy 2 level is at $1739.
"We are in a major area of support," MontesDeOca said. "You want to be careful going short down here, since the probabilities are that the market will revert from these levels."
There is a 90% chance that the market will revert from $1755 and 95% chance that it will revert from $1739 on the daily numbers. There is a lot of support down here based on the weekly numbers. Gold is an area of accumulation, so wait for a daily trigger at $1745 to buy the market and go long.
MontesDeOca said:
We seem to be looking for the annual bottom in gold to come in for this 360-day seasonal pattern, which began in September... Hopefully from that bottom, we are looking for an acceleration to the upside like we have never seen before. Be patient. It's been frustrating this past year, based on the fundamentals, but a big move up is coming. Continue to hold onto your long positions.


Comments
Log in or sign up to join the conversation.