

Image Source: Pixabay
- EUR/USD strengthened as ECB President Lagarde stated that it is premature to declare victory over inflation.
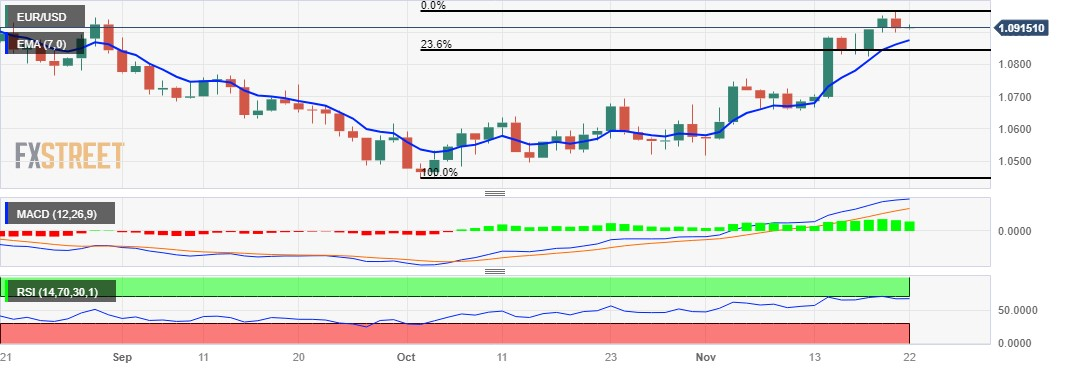
- The pair could re-attempt to reach the 1.1000 psychological level as technical indicators support the upward trend.
- The psychological level at 1.0900 acts as the immediate support backed by the seven-day EMA at 1.0874.
EUR/USD attempts to recover its losses recorded in the previous session, trading slightly higher around 1.0910 during the Asian session on Wednesday. The European Central Bank (ECB) President Christine Lagarde's hawkish statements overnight provide some support for the EUR/USD pair.
President Lagarde stated at a Berlin event that it is too early to declare victory over inflation and that bets based on short-term data flow are premature.
The technical indicators for the EUR/USD pair support the current upward trend. The 14-day Relative Strength Index (RSI) above 50 indicates bullish sentiment, indicating that the pair is gaining momentum.
Furthermore, the Moving Average Convergence Divergence (MACD) line is above the centerline, with divergence above the signal line, indicating that the EUR/USD pair could re-attempt to target the barrier at the 1.1000 psychological level, following August’s high at 1.1064.
On the downside, the psychological level at 1.0900 emerges as the immediate support, following the seven-day Exponential Moving Average (EMA) at 1.0874 followed by the next major level at 1.0850. A decisive break below the level could put pressure on the EUR/USD pair to navigate the region around the 23.6% Fibonacci retracement at 1.0841.
EUR/USD: Daily Chart
(Click on image to enlarge)
EUR/USD: MORE TECHNICAL LEVELS TO WATCH
| OVERVIEW | |
|---|---|
| Today last price | 1.0912 |
| Today Daily Change | 0.0000 |
| Today Daily Change % | 0.00 |
| Today daily open | 1.0912 |
| TRENDS | |
|---|---|
| Daily SMA20 | 1.0716 |
| Daily SMA50 | 1.064 |
| Daily SMA100 | 1.0792 |
| Daily SMA200 | 1.0807 |
| LEVELS | |
|---|---|
| Previous Daily High | 1.0965 |
| Previous Daily Low | 1.09 |
| Previous Weekly High | 1.0909 |
| Previous Weekly Low | 1.0665 |
| Previous Monthly High | 1.0695 |
| Previous Monthly Low | 1.0448 |
| Daily Fibonacci 38.2% | 1.0925 |
| Daily Fibonacci 61.8% | 1.094 |
| Daily Pivot Point S1 | 1.0886 |
| Daily Pivot Point S2 | 1.0861 |
| Daily Pivot Point S3 | 1.0821 |
| Daily Pivot Point R1 | 1.0951 |
| Daily Pivot Point R2 | 1.0991 |
| Daily Pivot Point R3 | 1.1016 |
More By This Author:
GBP/USD Holds Steady Near Its Highest Level Since September 9, Just Below Mid-1.2500sPalantir Stock Forecast: PLTR Falls 7% As Market Awaits Nvidia Earnings
US Dollar Flattens Ahead Of Fed Minutes Publication


Comments
Log in or sign up to join the conversation.