
The Euro has been on a tear against the US Dollar over the past two weeks. EUR/USD has climbed 1.6% over that time period, the strongest performance over the course of two weeks since late January (FXE, UDN).
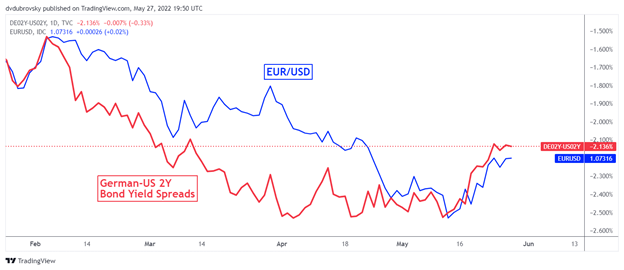
You do not have to look far to understand what is going on here. On the chart below, EUR/USD has been rising as German front-end government bond yields have been outperforming their Treasury equivalent.
In fact, the US Dollar has been broadly on the decline over the past two weeks. This has been increasingly associated with more cautious commentary from the Federal Reserve regarding the path forward for interest rates. We have seen the markets price out most of the anticipated tightening in 2023. Odds of a 50-basis point hike in September have been dwindling amid more cautious commentary from the Fed.
Meanwhile, the European Central Bank has been doing the opposite of the Fed. This past week, ECB Governing Council member Martins Kazaks said that the central bank should not rule out half-point rate hikes. Similar commentary was also heard from Governing Council member Robert Holzmann. This is in contrast to ECB President Christine Lagarde, who has a more cautious view.
Looking at the week ahead, the data can explain the increasingly hawkish view across policymakers. German inflation is expected at 7.6% y/y in May from 7.4% prior. This is as Euro Area unemployment is seen falling to 6.7% in April from 6.8% prior.
However, traders should be wary of the markets perhaps getting ahead of themselves as Fed policy expectations cool. The US unemployment rate is expected to cool further to 3.5% in May from 3.6% prior. Average hourly earnings are also seen remaining robust. This could offer some life back to the US Dollar.
EUR/USD Fundamental Drivers
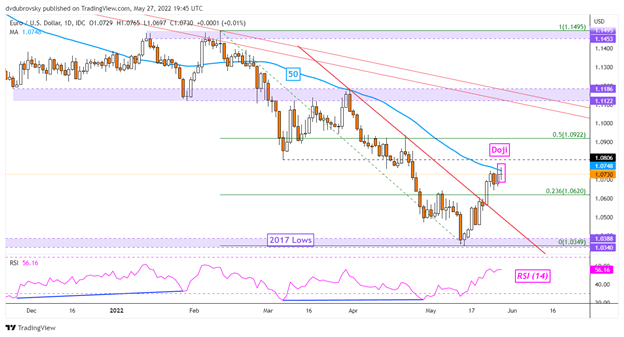
EUR/USD Technical Analysis – Daily Chart
On the daily chart, EUR/USD has left behind a neutral Doji candlestick pattern. This follows multiple failed attempts to clear resistance, which seems to be the 50-day Simple Moving Average. Could this be a sign of an impending turn lower as momentum fades? The Doji could become active in the event of downside follow-through. That could increase the odds of a reversal.
Such an outcome would place the focus on the 1.0340 – 1.0388 support zone. For the time being, the break above the falling trendline from March remains active. However, falling resistance from May 2021 is maintaining the broader downside focus. Getting there does entail clearing the midpoint of the Fibonacci retracement at 1.0922.


Comments
Log in or sign up to join the conversation.