EUR/JPY Price Prediction: Continues To Pullback To Trendline For Sept-Oct Rally
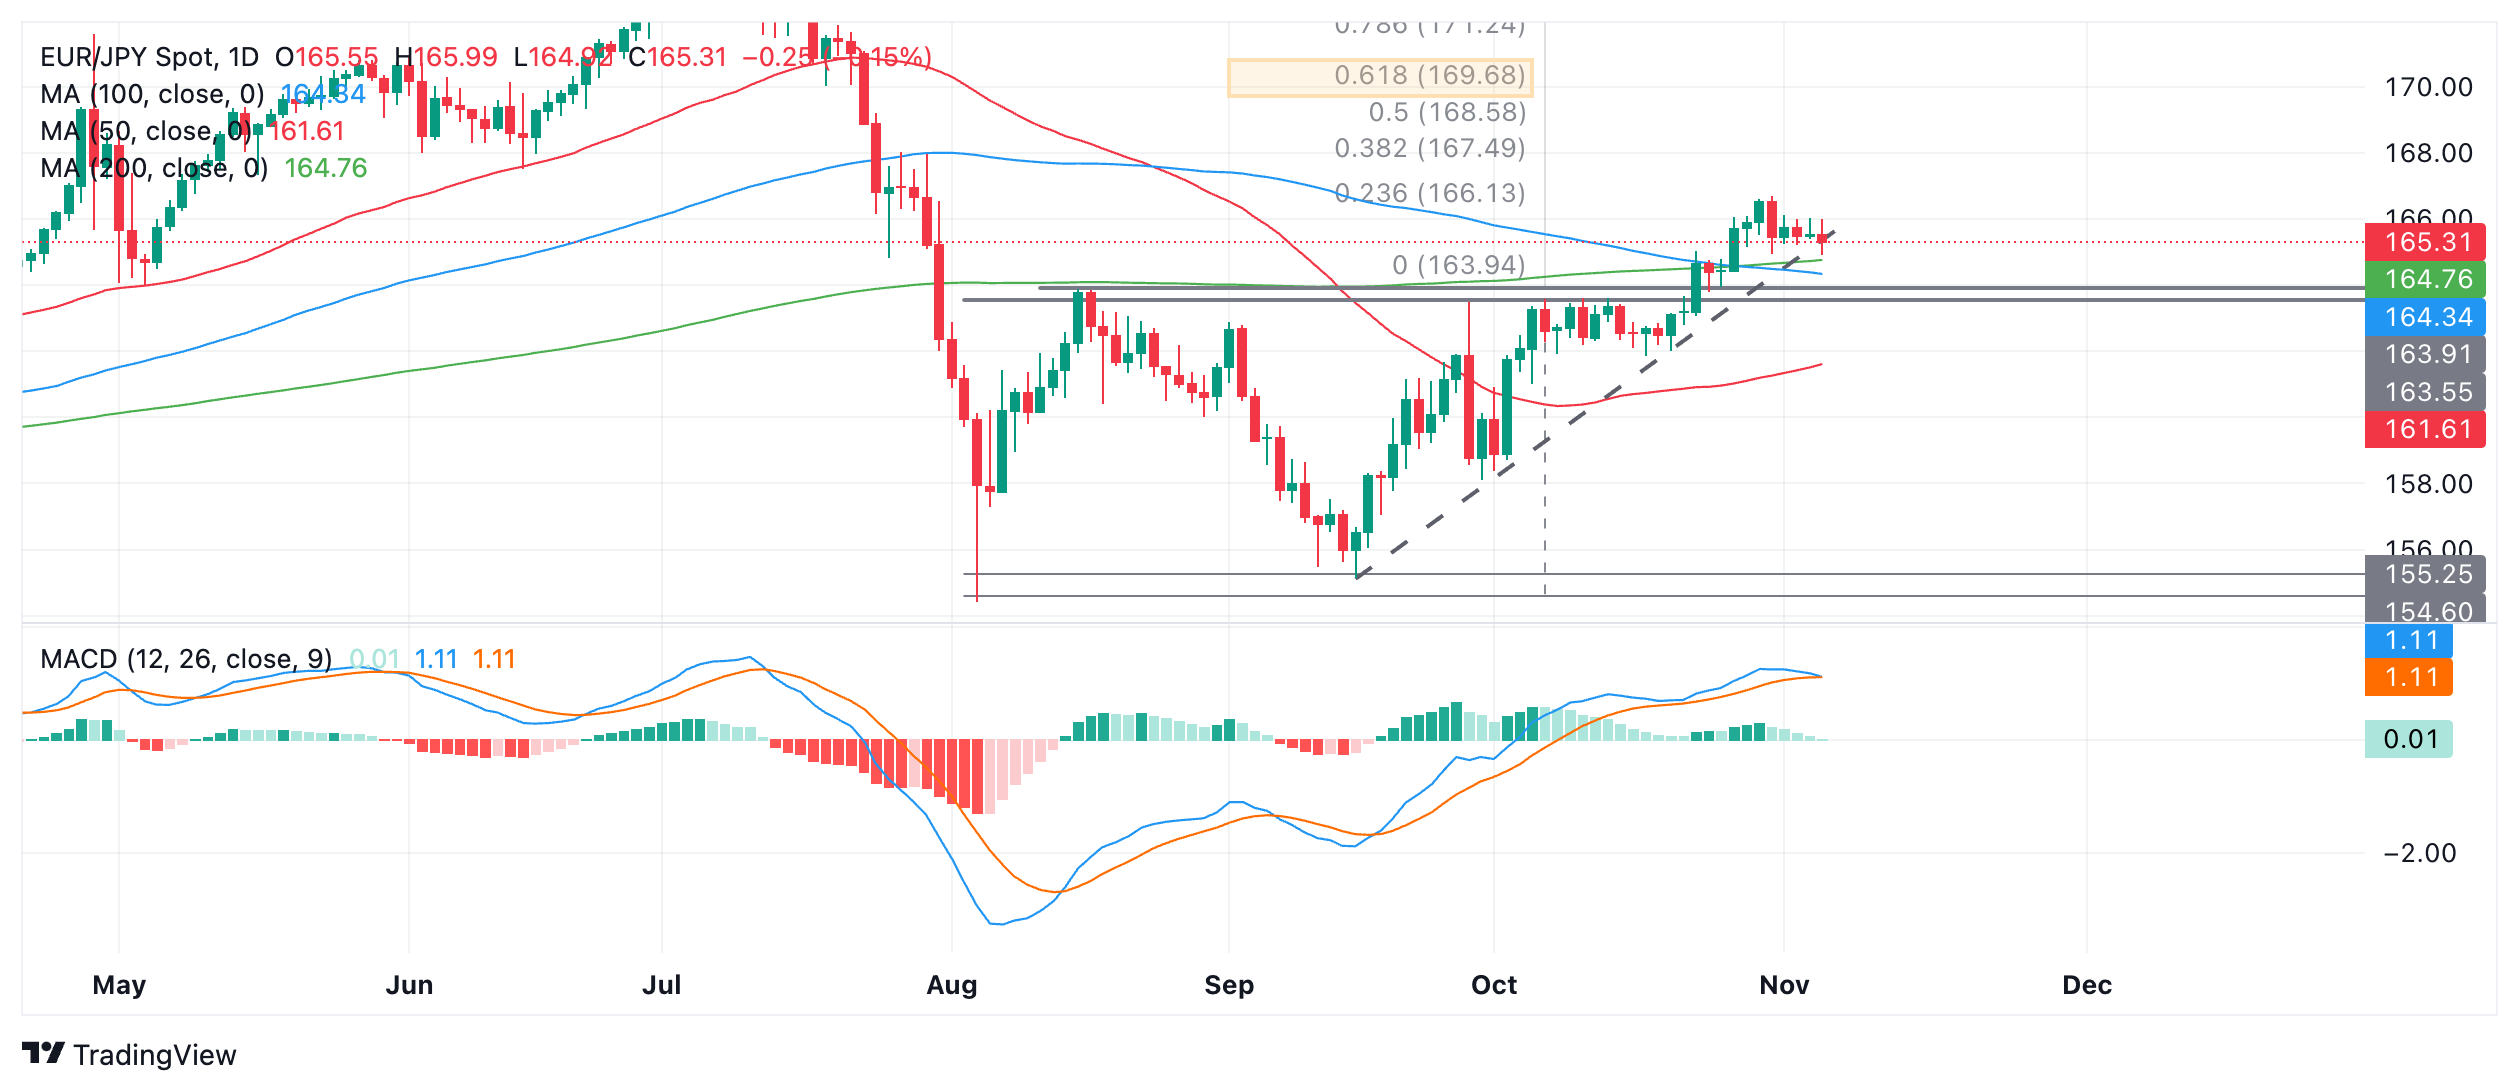
EUR/JPY continues its pullback to the trendline (dashed line on chart) for the September-October rally.
The pair is in a short and medium-term uptrend which given the technical analysis maxim that “the trend is your friend” is favored to continue higher.
EUR/JPY Daily Chart
(Click on image to enlarge)
A break above 166.69 (October 31 high) would probably confirm such a continuation higher.
Resistance at 167.96 (July 30 swing high) could provide an initial target and act as a barrier to further upside.
The minimum target for the breakout from the range, however, lies higher, at 169.68, the 61.8% Fibonacci extrapolation of the height of the range to the upside (orange-shaded rectangle).
The Moving Average Convergence Divergence (MACD) is threatening to cross below its signal line, however – a mildly bearish sign which could indicate further near-term weakness for the pair.
There is also an open gap just below price which is only visible on the intraday charts at 164.90. Gaps have a habit of getting filled. If so, further weakness may be on the horizon, with price falling to the bottom of the open gap at 164.45.
More By This Author:
NZD/USD Trends Lower After Trump Victory And Weak NZ Employment DataAUD/USD Rebounds From Multi-month Low, Finds Support Ahead Of 0.6500 Mark
Pound Sterling Price News And Forecast: GBP Moves Higher In Us Presidential Election Day
Information on these pages contains forward-looking statements that involve risks and uncertainties. Markets and instruments profiled on this page are for informational purposes only and should not ...
more


