
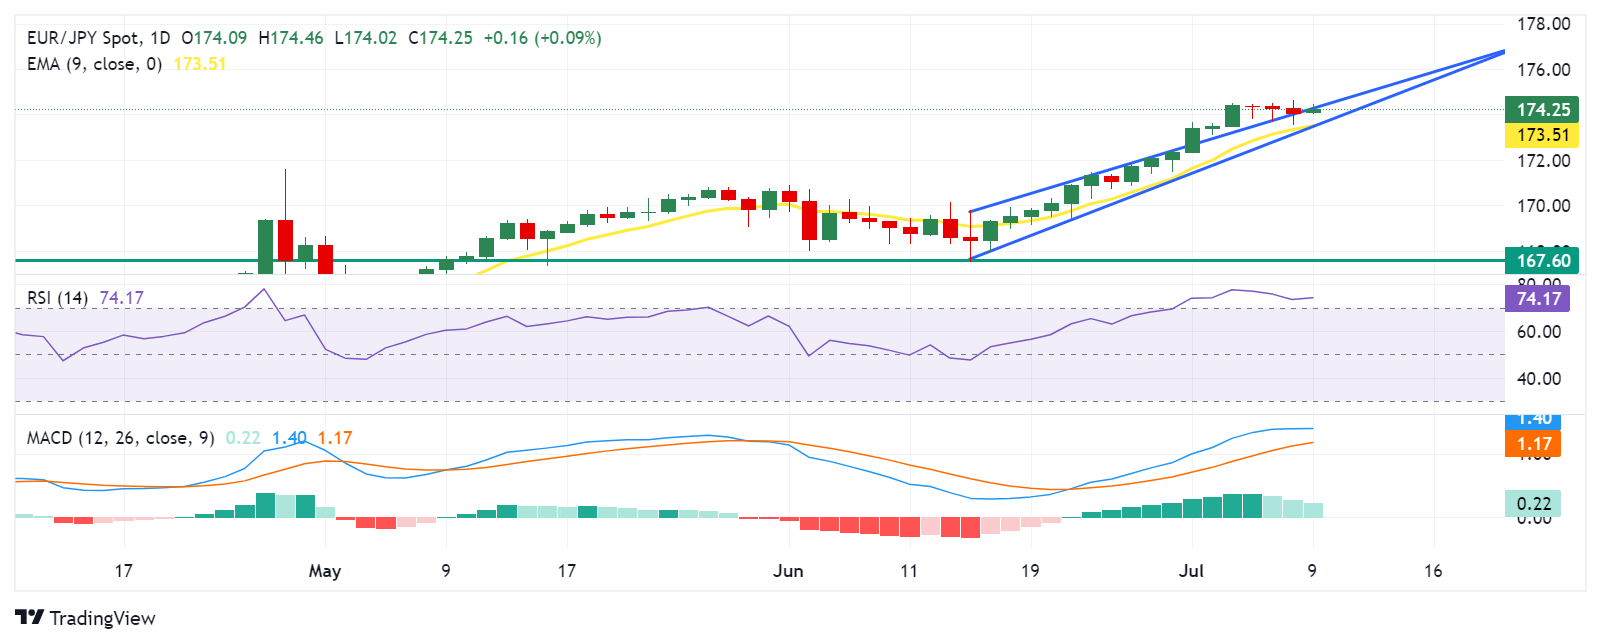
EUR/JPY halts its three-day losing streak, trading around 174.30 during the European hours on Tuesday. The analysis of the daily chart shows a rising wedge pattern, indicating a potential bearish reversal. Furthermore, the 14-day Relative Strength Index (RSI) is above the 70 level, suggesting the currency asset is overbought and may face a correction.
The momentum indicator Moving Average Convergence Divergence (MACD) line is currently above both the centerline and the signal line, indicating confirmation of bullish momentum. Traders may anticipate additional movements, watching for potential shifts in momentum in the EUR/JPY cross.
The EUR/JPY cross faces potential resistance near the upper boundary of the rising wedge around the 174.40 level. A successful breakthrough above this level could strengthen the bullish bias and lead the cross toward the psychological level of 175.00.
On the downside, the key support appears around the nine-day Exponential Moving Average (EMA) at 173.52, followed by the lower boundary of the rising wedge around the level of 173.50. A break below the latter could exert downward pressure on the EUR/JPY cross to navigate the region around the psychological level of 170.00
Further decline may increase the selling pressure on the EUR/JPY cross to navigate the vicinity around the throwback support at 167.60.
EUR/JPY: Daily Chart
(Click on image to enlarge)
EURO PRICE TODAY
The table below shows the percentage change of Euro (EUR) against listed major currencies today. Euro was the strongest against the New Zealand Dollar.
| USD | EUR | GBP | JPY | CAD | AUD | NZD | CHF | |
|---|---|---|---|---|---|---|---|---|
| USD | 0.02% | -0.02% | 0.08% | 0.00% | -0.04% | 0.12% | 0.00% | |
| EUR | -0.02% | -0.05% | 0.07% | -0.03% | -0.06% | 0.10% | -0.02% | |
| GBP | 0.02% | 0.05% | 0.12% | 0.02% | 0.01% | 0.15% | 0.02% | |
| JPY | -0.08% | -0.07% | -0.12% | -0.10% | -0.14% | 0.00% | -0.11% | |
| CAD | -0.00% | 0.03% | -0.02% | 0.10% | -0.06% | 0.13% | -0.01% | |
| AUD | 0.04% | 0.06% | -0.01% | 0.14% | 0.06% | 0.14% | 0.00% | |
| NZD | -0.12% | -0.10% | -0.15% | -0.01% | -0.13% | -0.14% | -0.12% | |
| CHF | -0.00% | 0.02% | -0.02% | 0.11% | 0.01% | -0.00% | 0.12% |
The heat map shows percentage changes of major currencies against each other. The base currency is picked from the left column, while the quote currency is picked from the top row. For example, if you pick the Euro from the left column and move along the horizontal line to the US Dollar, the percentage change displayed in the box will represent EUR (base)/USD (quote).
More By This Author:
WTI Depreciates To Near $81.50, Saudi Expects To Rebound Oil Exports To ChinaUSD/CAD Remains Below 1.3650 Due To Dovish Sentiment Surrounding The Fed
Silver Price Forecast: XAG/USD Holds Position Above $30.50 Ahead Of US NFP


Comments
Log in or sign up to join the conversation.