EUR/JPY Price Analysis: Extends Its Downside, The Next Contention Level Is Seen At 161.60
Image Source: Unsplash
- EUR/JPY loses traction amid the lack of a catalyst in early European session on Tuesday.
- The bullish outlook remains intact as the cross still holds above the key 100-hour EMA.
- The immediate resistance level is located at 161.46; the initial support level is seen at 161.60.
The EUR/JPY cross extends its downside during the early European session on Tuesday. That being said, the lack of a catalyst triggers the demand for safe-haven flows, which lifts the Japanese Yen (JPY) against the Euro (EUR). Market players await the speech by European Central Bank (ECB) President Christine Lagarde at high-level public discussion "Inflation kills democracy” at 06.00 GMT for fresh impetus. The cross currently trades around 161.83, losing 0.29% on the day.
On Tuesday, ECB Governing Council member Francois Villeroy de Galhau said that interest rates have reached a plateau where they will remain for the next few quarters. However, he dismissed discussion of a rate cut as premature.
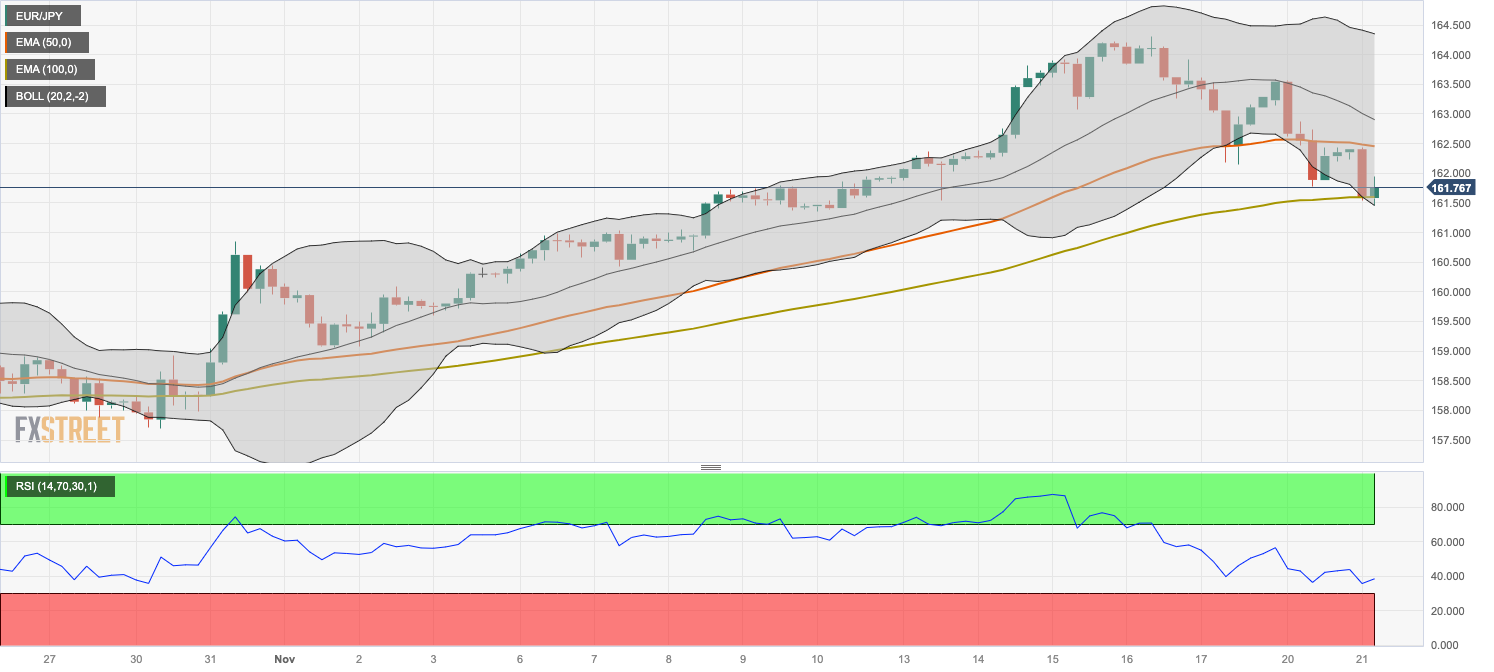
Technically, the bullish outlook remains intact as the cross still holds above the key 100-hour Exponential Moving Averages (EMAs) on the four-hour chart. However, the Relative Strength Index (RSI) is located in the bearish territory below 50, indicating the pair's upside is likely to remain limited in the near term.
The 50-hour EMA at 161.46 acts as an immediate resistance level for the cross. The additional upside filter to watch is a high of November 20 at 163.56. The next barrier is seen at the upper boundary of Bollinger Band and a high of November 16 at 164.34. A break below the latter will see the rally to the year-to-date (YTD) high of 164.21.
On the other hand, the initial support level for EUR/JPY is seen near the 100-hour EMA at 161.60. Further south, the cross will see the next downside target near the lower limit of the Bollinger Band at 161.48. A breach of the latter will see a drop to a high of October 31 at 160.85, followed by the psychological round figure at 160.00.
EUR/JPY four-hour chart
(Click on image to enlarge)
EUR/JPY
| OVERVIEW | |
|---|---|
| Today last price | 161.87 |
| Today Daily Change | -0.44 |
| Today Daily Change % | -0.27 |
| Today daily open | 162.31 |
| TRENDS | |
|---|---|
| Daily SMA20 | 160.91 |
| Daily SMA50 | 159 |
| Daily SMA100 | 158.07 |
| Daily SMA200 | 152.83 |
| LEVELS | |
|---|---|
| Previous Daily High | 163.56 |
| Previous Daily Low | 161.78 |
| Previous Weekly High | 164.31 |
| Previous Weekly Low | 161.54 |
| Previous Monthly High | 160.85 |
| Previous Monthly Low | 154.39 |
| Daily Fibonacci 38.2% | 162.46 |
| Daily Fibonacci 61.8% | 162.88 |
| Daily Pivot Point S1 | 161.54 |
| Daily Pivot Point S2 | 160.76 |
| Daily Pivot Point S3 | 159.75 |
| Daily Pivot Point R1 | 163.32 |
| Daily Pivot Point R2 | 164.33 |
| Daily Pivot Point R3 | 165.1 |
More By This Author:
S&P 500 Forecast: Quiet Thanksgiving Week Makes Nvidia Earnings The Focal PointGBP/USD Climbs Back Closer To Over Two-Month Top, Bulls Flirt With 100-day SMA Near 1.2500
Silver Price Analysis: XAG/USD Consolidates Gains, Still Outlook Looks Bright
Disclosure: Information on this article contains forward-looking statements that involve risks and uncertainties. Markets and instruments profiled on this page are for informational purposes ...
more


