
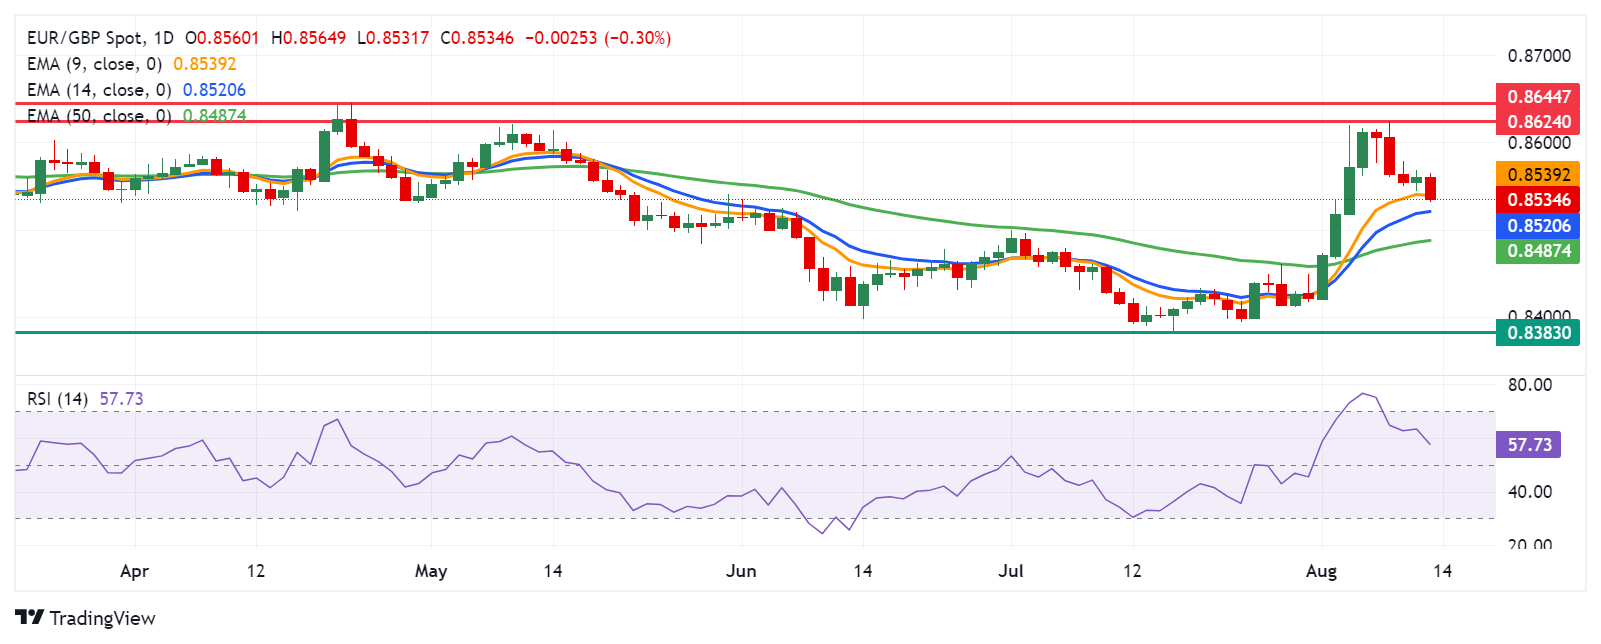
EUR/GBP retraces its recent gains from the previous session, trading around 0.8530 during the European hours on Tuesday. The daily chart analysis shows the EUR/GBP cross has broken below the nine-day Exponential Moving Average (EMA) at 0.8539 level, signaling the onset of a bearish trend in the short term.
However, the momentum indicator 14-day Relative Strength Index (RSI) remains above the 50 level, suggesting a bullish bias for the EUR/GBP cross. Further depreciation toward the 50 level would suggest the easing of bullish momentum.
In terms of resistance, the EUR/GBP cross could find an immediate barrier at a three-month high of 0.8624 level marked on August 8, followed by a seven-month high of 0.8644 level recorded on April 23. A break above the latter could strengthen the currency cross to explore the region around the psychological level of 0.8700.
On the downside, the immediate support appears at the 14-day EMA at 0.8520 level, followed by the EUR/GBP cross to test the 50-day EMA at 0.8487 level. A break below this support could suggest a confirmation of a bearish trend, potentially driving the cross toward a throwback support level at 0.8383.
EUR/GBP: Daily Chart
(Click on image to enlarge)
Euro PRICE Today
The table below shows the percentage change of Euro (EUR) against listed major currencies today. Euro was the weakest against the New Zealand Dollar.
| USD | EUR | GBP | JPY | CAD | AUD | NZD | CHF | |
|---|---|---|---|---|---|---|---|---|
| USD | 0.15% | -0.18% | 0.37% | -0.04% | -0.17% | 0.19% | 0.27% | |
| EUR | -0.15% | -0.32% | 0.21% | -0.22% | -0.33% | -0.47% | 0.12% | |
| GBP | 0.18% | 0.32% | 0.55% | 0.12% | -0.01% | -0.13% | 0.47% | |
| JPY | -0.37% | -0.21% | -0.55% | -0.44% | -0.53% | -0.67% | -0.09% | |
| CAD | 0.04% | 0.22% | -0.12% | 0.44% | -0.12% | -0.26% | 0.33% | |
| AUD | 0.17% | 0.33% | 0.00% | 0.53% | 0.12% | -0.11% | 0.47% | |
| NZD | -0.19% | 0.47% | 0.13% | 0.67% | 0.26% | 0.11% | 0.59% | |
| CHF | -0.27% | -0.12% | -0.47% | 0.09% | -0.33% | -0.47% | -0.59% |
The heat map shows percentage changes of major currencies against each other. The base currency is picked from the left column, while the quote currency is picked from the top row. For example, if you pick the Euro from the left column and move along the horizontal line to the US Dollar, the percentage change displayed in the box will represent EUR (base)/USD (quote).
More By This Author:
Australian Dollar Edges Higher Following Key Economic DataUS Dollar Index Price Forecast: Remains Above 103.00 With Expecting A Trend Reversal
Australian Dollar Grapples To Hold Position Despite Upbeat China Inflation


Comments
Log in or sign up to join the conversation.