EUR/GBP Price Analysis: Remains Subdued And Oscillates Above 0.8600 Amid Risk-Off Impulse

Image Source: Pixabay
- EUR/GBP encounters resistance, lingering below the pivotal 200-DMA of 0.8700, spotlighting downside risks.
- A breach below 0.8605 could unlock further descent, targeting September lows and potentially the YTD low.
- Recovery above 0.8658 may pave the way for a test of the crucial 0.8700 psychological and technical barrier.
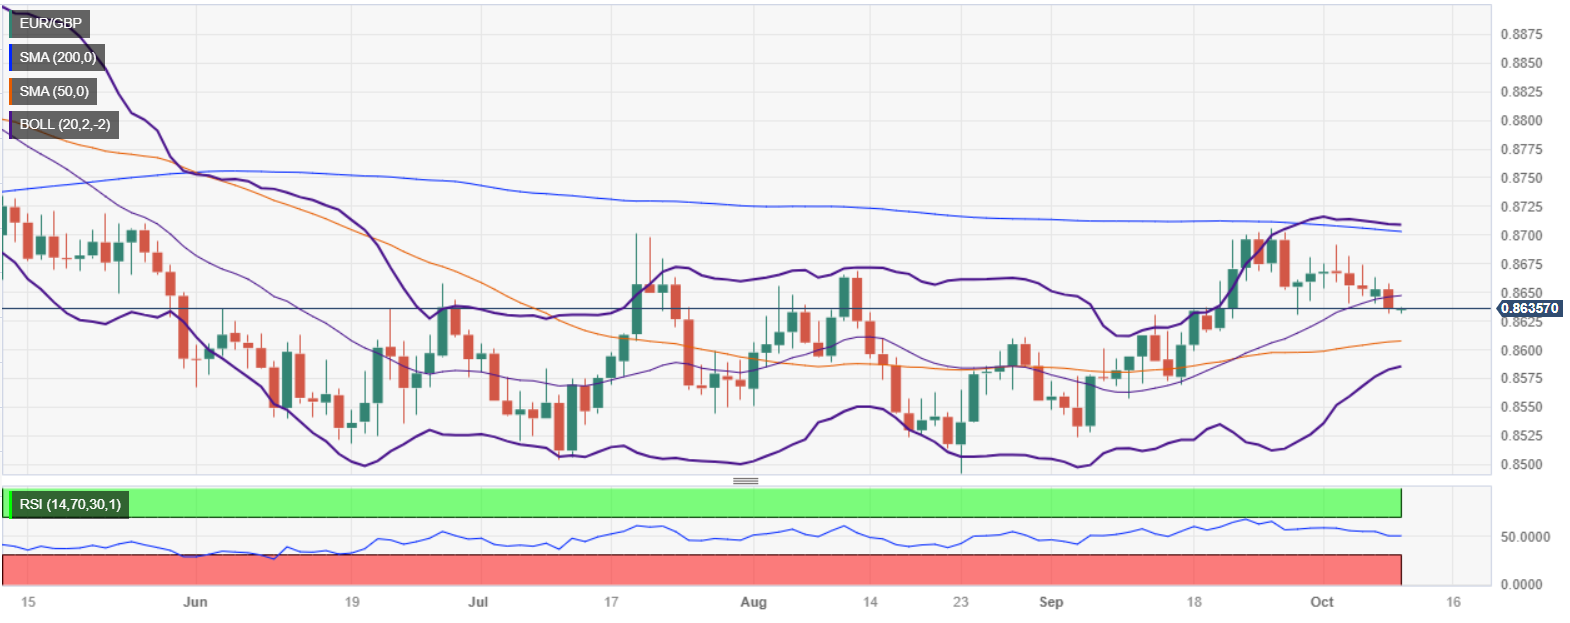
The EUR/GBP extended its losses to five straight trading days and hovers at around the September 28 swing low of 0.8629, amidst a risk-off impulse courtesy of the escalation of the fight between Hamas and Israel, set to extend for the fourth straight day. Therefore, the EUR/GBP edges lower by 0.05%, and exchanges hands at around 0.8635.
The daily chart portrays the pair as neutral biased, but it appears to have bottomed, as shown by price action; nevertheless, as EUR/GBP’s price action remains trading below the 200-day moving average (DMA) of 0.8700, downside risks remain. For a bearish continuation, sellers must break below the 50-DMA at 0.8605. A breach of the latter and the 0.8600 figure would expose the September 15 daily low of 0.8569, followed by the September 5 low of 0.8523. Once those levels are cleared, up next would be the year-to-date (YTD) low of 0.8492.
Conversely, If EUR/GBP buyers reclaim the October 9 daily high at 0.8658, that would open the door to test the confluence of the figure and the 200-DMA at 0.8700. A decisive break would expose the May 3 high at 0.8834.
EUR/GBP Price Action – Daily chart
(Click on image to enlarge)
EUR/GBP Key Technicals
EUR/GBP
| OVERVIEW | |
|---|---|
| Today last price | 0.8636 |
| Today Daily Change | -0.0017 |
| Today Daily Change % | -0.20 |
| Today daily open | 0.8653 |
| TRENDS | |
|---|---|
| Daily SMA20 | 0.8644 |
| Daily SMA50 | 0.8606 |
| Daily SMA100 | 0.8601 |
| Daily SMA200 | 0.8705 |
| LEVELS | |
|---|---|
| Previous Daily High | 0.8663 |
| Previous Daily Low | 0.8641 |
| Previous Weekly High | 0.8691 |
| Previous Weekly Low | 0.864 |
| Previous Monthly High | 0.8706 |
| Previous Monthly Low | 0.8524 |
| Daily Fibonacci 38.2% | 0.8655 |
| Daily Fibonacci 61.8% | 0.8649 |
| Daily Pivot Point S1 | 0.8641 |
| Daily Pivot Point S2 | 0.863 |
| Daily Pivot Point S3 | 0.8619 |
| Daily Pivot Point R1 | 0.8664 |
| Daily Pivot Point R2 | 0.8675 |
| Daily Pivot Point R3 | 0.8686 |
More By This Author:
DXY Fails To Hold Momentum, Declines Near 106.00GBP/USD Retreats And Snap Three Days Of Gains Amid Escalating Middle East Conflict
USD/JPY Drops On Risk-Aversion Spurred On Middle-East Tensions, Falling U.S. Bond Yields
Disclosure: Information on this article contains forward-looking statements that involve risks and uncertainties. Markets and instruments profiled on this page are for informational purposes ...
more


