
The EUR/GBP wraps up another trading week just shy of 0.8750 after seeing five straight days of gains with the Pound Sterling (GBP) waffling against the Euro (EUR) for the entire week.
EU and UK economic data mixed on forecasts across the board this week, but it's getting difficult for investors to ignore the fact that UK data beats, even when they clear forecasts, still leaves economic indicators middling at best.
UK Gross Domestic Product (GDP) figures held steady for the year into September at 1.5% instead of declining to 1.1% as markets had expected, and UK Manufacturing Production for the same period held flat at 3% versus the expected growth to 3.1%, and the previous figure being revised from 28% to 3.0%.
Next Up: hectic data schedule for EU & UK
Next Tuesday sees UK labor and wage figures, while the EU will be releasing their own GDP figures for the third quarter.
Wednesday delivers UK Consumer Price Index (CPI) inflation data, paired with EU Industrial production.
Next week will close out high-impact data with UK Retail Sales and EU Harmonized Index of Consumer Prices (HICP) on Friday.
EUR/GBP Technical Outlook
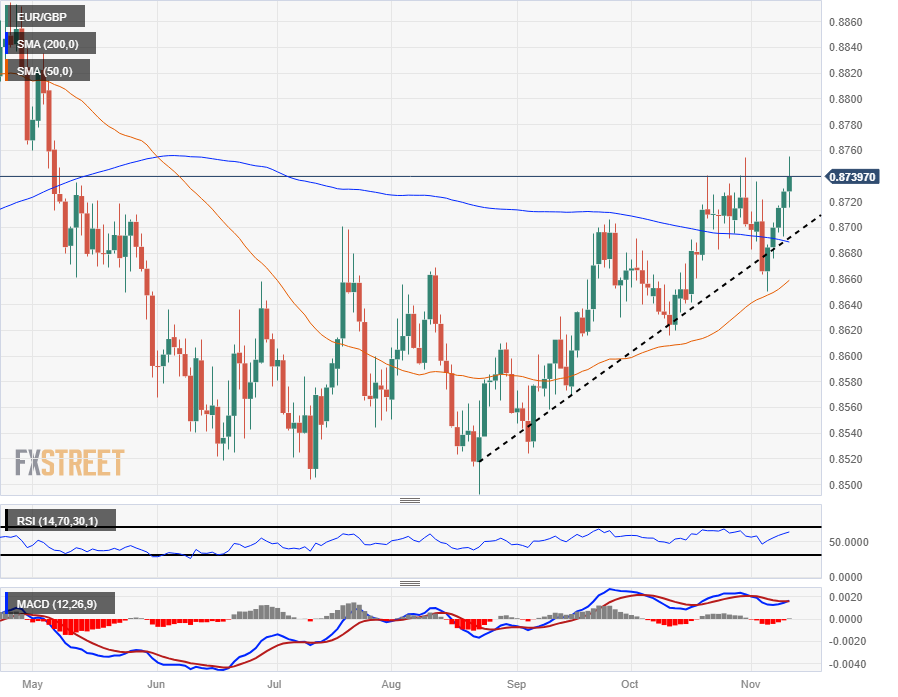
The EUR/GBP chalked in five straight green bars, climbing back over the 200-day Simple Moving Average (SMA) and pushing back into near-term high bids as the Euro rallies against the Pound Sterling.
The pair has continued to etch in higher lows along a rising trendline from August's low closes near 0.8520, and the 50-day SMA is accelerating from 0.8660 towards a bullish cross of the 200-day SMA, which is currently parked near 0.8690.
EUR/GBP Daily Chart
(Click on image to enlarge)
EUR/GBP Technical Levels
EUR/GBP
| OVERVIEW | |
|---|---|
| Today last price | 0.874 |
| Today Daily Change | 0.0012 |
| Today Daily Change % | 0.14 |
| Today daily open | 0.8728 |
| TRENDS | |
|---|---|
| Daily SMA20 | 0.8698 |
| Daily SMA50 | 0.8655 |
| Daily SMA100 | 0.862 |
| Daily SMA200 | 0.869 |
| LEVELS | |
|---|---|
| Previous Daily High | 0.873 |
| Previous Daily Low | 0.8693 |
| Previous Weekly High | 0.8754 |
| Previous Weekly Low | 0.8664 |
| Previous Monthly High | 0.8754 |
| Previous Monthly Low | 0.8616 |
| Daily Fibonacci 38.2% | 0.8716 |
| Daily Fibonacci 61.8% | 0.8707 |
| Daily Pivot Point S1 | 0.8704 |
| Daily Pivot Point S2 | 0.868 |
| Daily Pivot Point S3 | 0.8667 |
| Daily Pivot Point R1 | 0.8741 |
| Daily Pivot Point R2 | 0.8754 |
| Daily Pivot Point R3 | 0.8778 |
More By This Author:
Gold Price Analysis: Hawkish Fed Pushed Gold Further Down, XAU/USD Tested $1,930
Crude Oil Looking To Firm Up A Bounce From $76
US Dollar Rallies As Powell Delivers Harsh Warning On Rate Hikes


Comments
Log in or sign up to join the conversation.