Equity Reallocation Between US, Developed And Emerging Markets
Within the equity allocation of portfolios, with tax awareness, we are taking these actions in discretionary accounts, and are recommending these actions in advice & consent accounts, and in coaching relationships:
- Underweight US stocks (preferably to less than the 52% world weight)
- Overweight non-US Developed Mkt stocks (preferably to more than the 39% world weight)
- Overweight Emerging Mkt stocks (preferably to more than the 9% world weight)
We have been strongly overweight US stocks within the equity allocation for years, and that has been beneficial; but now evidence suggests that greater opportunity lies in other parts of the world.
A significant challenge we face is the pretty much across the board embedded gains in our stock positions. Reallocation in tax deferred accounts is not a problem, but in regular taxable accounts, we need to understand the taxable gain preferences (and tax loss carry-forwards) of our clients versus their need to reallocate.
The following information supporting our view provides:
- Comparative valuation measures for the three regions (US, non-US Developed and Emerging markets)
- What is fair value of stocks today relative to bonds?
- Recent and multi-year relative total return performance of the three regions versus the world index
- Multi-period institutional forward return forecasts for the three regions
- Net flow of funds to US and International/Global mutual funds and ETFs
- Current short-term technical ratings for the three regions and the world
- QVM intermediate-term trend ratings for the three regions and the world.
COMPARATIVE VALUATION MEASURES
- Price-to-Book Value Ratio
- Price-to-Sales Ratio
- Price-to-10yr Av Earnings Ratio (by Robert Shiller, Yale Economist, Nobel laureate)
- Price-to-Highest Historical Earnings Ratio (by John Hussman, analyst and mutual fund manager)
- Price-to-Total of Book Value and Debt (by James Tobin, deceased Yale Economist, Nobel laureate)
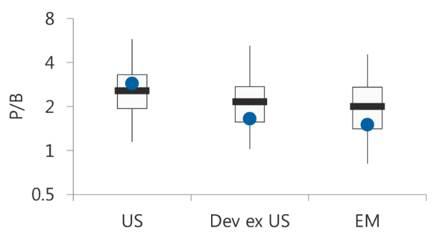
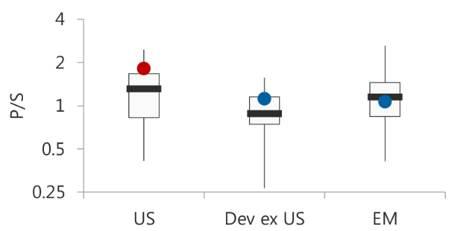
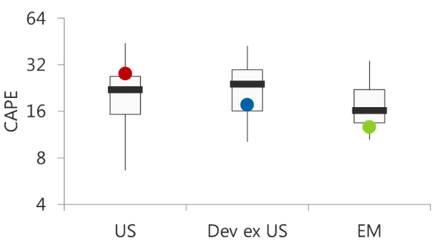
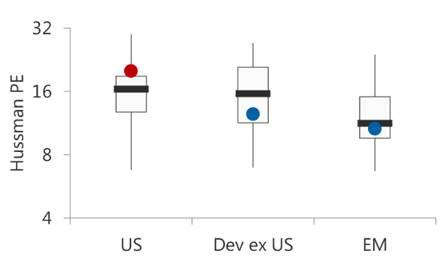
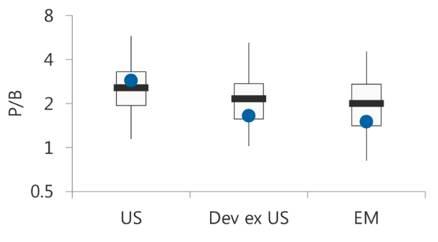
The short-story here is that by each measure, the US is the most expensive; non-US Developed markets are either somewhat less expensive or mostly significantly less expensive, and Emerging markets are significantly less expensive.If we are seeking best relative value, and potentially least exposed to valuation contraction, regions with lower Price-to-Whatever ratios are generally more attractive.
The following comparative valuation measures were generated recently by Research Affiliates for their January article, ”CAPE Fear: Why CAPE Naysayers Are Wrong”. Valuations are compared between the regions and for each region relative to its own history.
Each of the following measures presents the current value inside of a “box and whiskers, explained by this image:

Price-to-Book Ratio:
Price-to-Sales Ratio:
Price-to-10yr Av Earnings:
This ratio (commonly called CAPE, for cyclically adjusted Price Earnings Ratio, where the adjustment is an inflation adjustment to historical earnings) was developed by Robert Shiller, Yale Economist, based on the idea published by Benjamin Graham many years ago.
Hussman P/E Ratio:
John Hussman divides the current price by the highest prior peak earnings, to present the lowest possible P/E (most favorable) based on actual historical results.
Tobin’s Q Ratio:
Tobin’s Q ratio, is the ratio of the market expressed value of a company (as measured by the market value of its outstanding stock plus debt) divided by the current replacement cost of the company’s assets (actual replacement cost is a complex determination, so for simplicity book value is often used for replacement cost, which typically overstates the true ratio, because book value is after depreciation and is not inflation adjusted — however in a time series for a single security, or between indexes, it is probably useful).
WHAT IS A MEASURE OF FAIR VALUE TODAY RELATIVE TO BONDS?
One expert to consult is Benjamin Graham (1894-1976), the acknowledged farther of value investing (as well as professor to and eventual employer of Warren Buffet).
He wrote the seminal books: “Security Analysis” (1934) with David Dodd, and the “Intelligent Investor” (1949) which Warren Buffet described as “the best book about investing ever written.”I remember reading “Intelligent Investor” in the summer of 1968 while working trail crew on the Appalachian Trail between my Sophomore and Junior years in college.It was my first exposure to investing ideas.It was captivating then.
In “Common Sense Investing: The Papers of Benjamin Graham” (accessible here) he said:
“It seems logical to me that the earnings/price ratio of stocks generally should bear a relationship to bond interest rates.…I should want the Dow or Standard & Poor’s to return an earnings yield of at least four- thirds that on AAA bonds to give them competitive attractiveness with bond investments.”
Today, AAA credit yields 3.47%. Four thirds of that suggests an earnings yield is 4.63% (or a P/E ratio of 21.6). Prospectively, with the Fed on course to raise short-term rates by 0.5% to 1.0% in 2018, it is reasonable to assume that the AAA yield will be higher than 3.47% at the end of 2018, and that an attractive earnings yield would be higher than 4.63% (a P/E lower than 21.6).
Today, according to Vanguard, the trailing P/E on each of the funds respresenting world stocks and three stock regions are:
- World stocks (VT) P/E 18.9 (earnings yield 5.29%)
- Total US stocks (VTI) P/E 22.7 (earnings yield 4.41%)
- Large-Cap non-US Developed markets stocks (VEA) P/E 16.0 (earnings yield 6.25%)
- Large-Cap Emerging markets stocks (VWO) P/E 14.8 (earnings yield 6.76%)
This is just one generalized way to look at fair value, but given the source, it is worth noting.The US is somewhat expensive by this Graham metric.The world and non-US developed markets are attractive.Emerging markets are very attractive (and much more volatile – forecasted to be in the low 20’s versus mid-teens for US and non-US Developed markets).
COMPARATIVE TOTAL RETURN
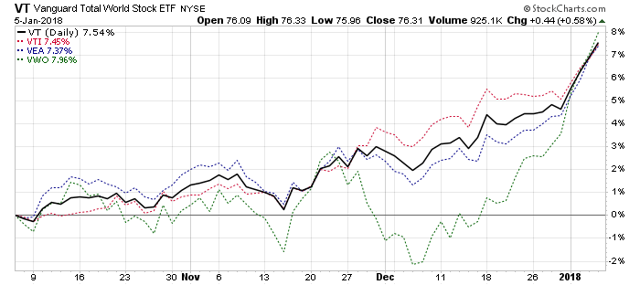
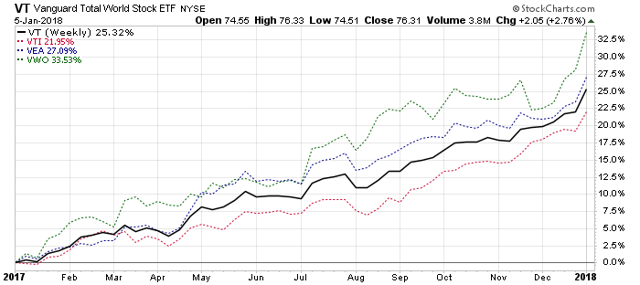
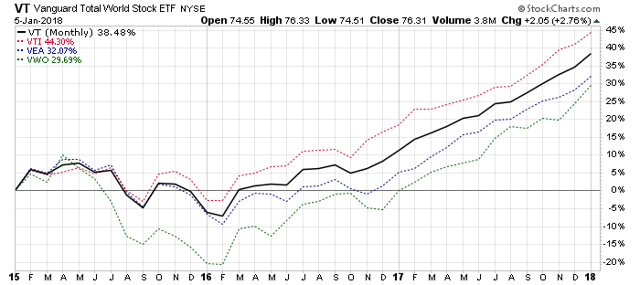
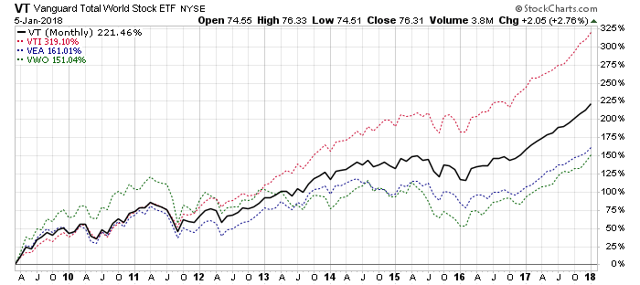
Each chart shows cumulative returns for total world stocks (VT) versus the total US stock market (VTI) and the large-cap non-US Developed markets (VEA) and the large-cap Emerging markets (VWO). The US has been the clear winner since the stock market bottom in March of 2009, but international markets have recently pulled ahead.Since the US has stretched the valuation rubber band more than the other two regions, that suggests greater forward opportunity internationally.
3 Months
1 Year
3 Years
From the 2009 US Stock Market Bottom
NET FLOW OF FUNDS
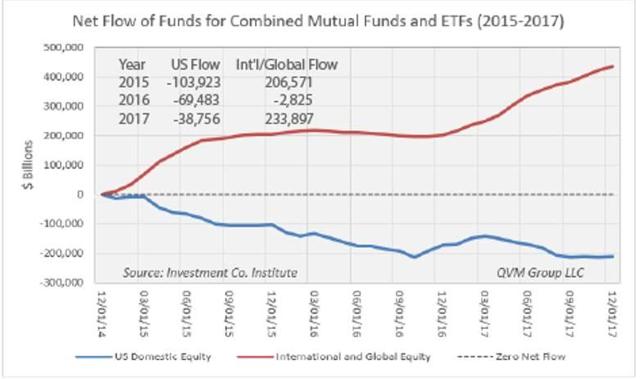
The Net Flow of Funds to mutual funds and ETFs has favored international and global funds over US domestic funds over the past 3 years. US domestic funds still outperformed international and global funds, but investor preference is clear in this chart. Until international and global funds show signs of overvaluation, “follow the money” may be a good thing to do.
INSTITUTIONAL FORWARD RETURN FORECASTS
While institutions vary in the magnitude of multi-year forward annualized total returns, they are in essential agreement in forecasting Emerging markets being the highest return opportunity among the three regions ( with significantly higher volatility than in the US or non-US Developed markets).US stocks are generally seen as offering the lowest returns.Institutional forecasts are consistent with the pattern of Net Flow of Funds.

CURRENT SHORT-TERM TECHNICAL CONDITION
These ratings come from BarChart.com. In their parlance, “short-term” is in the vicinity of 20 days; “medium-term” is in the vicinity of 50 days; and “long-term” is in the vicinity of 100 days – all of which we view as short-term.

QVM INTERMEDIATE TREND CONDITION
Our proprietary trend indicator is measured on a monthly basis over a period in excess of 1 year, and we believe indicates the intermediate trend condition. A description of the measurement method can be found here:
Note that while the world and all three regions are in strong positive up trend; but they are “running hot” and are “overbought” — suggesting a likely slowing or Correcting to cease being “overbought”.

Disclaimer: "QVM Invest", "QVM Research" are service marks of QVM Group LLC. QVM Group LLC is a registered investment advisor.
Important Note: This report is for informational purposes only, ...
more


Well worth the read.
Agreed.
Very kind. Thank you.