Elliott Wave Technical Analysis: TASI Index - Wednesday, Jan. 22
TASI Index Elliott Wave Analysis – Daily Chart
TASI Index Elliott Wave Technical Analysis
Technical Analysis Overview
- Function: Bullish Trend
- Mode: Impulsive
- Structure: Gray Wave 3
- Position: Orange Wave 3
- Direction (Next Higher Degrees): Gray Wave 3 (Started)
- Details: Gray Wave 2 completed, now Gray Wave 3 is in progress.
Wave Invalidation Level: 11,813.615
This analysis examines the TASI Index on the daily chart using Elliott Wave Theory. It identifies a bullish trend with an impulsive mode, focusing on the development of Gray Wave 3, which has started after the completion of Gray Wave 2, signaling the beginning of a significant upward movement.
Currently, the index is positioned within Orange Wave 3, which is a subwave of the broader Gray Wave 3 structure. The formation of Orange Wave 3 highlights continued bullish momentum, aligning with the progression of the higher-degree wave, suggesting further price appreciation as the trend unfolds.
The critical invalidation level is set at 11,813.615, serving as a key reference point. If the price falls below this threshold, the current bullish wave structure would be invalidated, requiring a reassessment of the market outlook and wave count.
Key Takeaways:
- The analysis presents a positive outlook for the TASI Index, emphasizing the strength of the ongoing Gray Wave 3, supported by the completion of Gray Wave 2.
- The active Orange Wave 3 indicates sustained upward momentum, offering traders potential opportunities for strategic positioning.
- The invalidation level of 11,813.615 acts as an essential marker for risk management, ensuring informed decision-making based on Elliott Wave principles.
This analysis provides traders with a clear framework for anticipating market movements, helping align their strategies with the bullish trend.
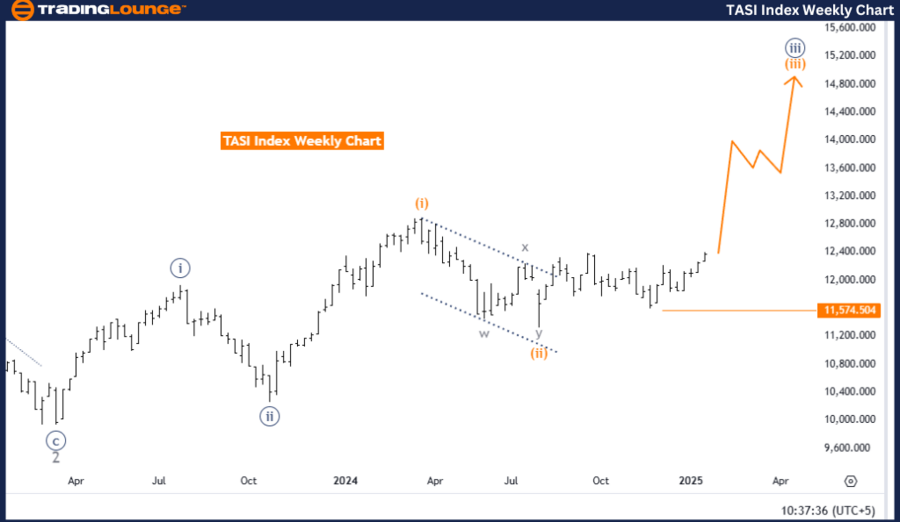
TASI Index Elliott Wave Analysis – Weekly Chart
TASI Index Wave Technical Analysis
Technical Analysis Overview
- Function: Bullish Trend
- Mode: Impulsive
- Structure: Orange Wave 3
- Position: Navy Blue Wave 3
- Direction (Next Higher Degrees): Orange Wave 3 (Started)
- Details: Orange Wave 2 completed, and Orange Wave 3 is now in progress.
Wave Invalidation Level: 11,574.504
This analysis evaluates the TASI Index on a weekly chart using Elliott Wave Theory, identifying a bullish trend within an impulsive mode. The primary focus is on the development of Orange Wave 3, which has commenced following the completion of Orange Wave 2, signaling the continuation of the market's upward trajectory.
Currently, the index is positioned within Navy Blue Wave 3, a subwave within the larger Orange Wave 3 structure. The progression of Navy Blue Wave 3 confirms sustained bullish momentum, aligning with the broader Elliott Wave pattern. This ongoing trend suggests further potential for price increases as the wave structure continues to develop.
The critical invalidation level for this wave count is set at 11,574.504, serving as a key benchmark for market evaluation. A price drop below this level would invalidate the current bullish wave count, requiring a reassessment of the market outlook and wave positioning.
Key Takeaways:
- The weekly chart analysis presents a favorable bullish outlook, supported by the active Orange Wave 3, following the successful completion of Orange Wave 2.
- The ongoing development of Navy Blue Wave 3 highlights continued upward momentum, offering traders potential opportunities for strategic positioning.
- The invalidation level of 11,574.504 serves as a critical reference point for risk management and market reassessment.
This structured analysis provides traders with a well-defined framework for anticipating market movements and aligning strategies with the evolving bullish trend.
Technical Analyst : Malik Awais
More By This Author:
Elliott Wave Technical Analysis: Theta Token Crypto Price News For Wednesday, Jan 22
Elliott Wave Technical Forecast: Westpac Banking Corporation
Elliott Wave Technical Analysis - Netflix Inc. (NFLX)
Analyst Peter Mathers TradingLounge™ Australian Financial Services Licence - AFSL 317817

.thumb.png.a3604e2c58018fbb9229e4bf1774e454.png)


