
S&P BSE SENSEX NEXT 50 – Elliott Wave Analysis Trading Lounge Day Chart
S&P BSE SENSEX NEXT 50 Wave Technical Analysis
FUNCTION: Bullish Trend
MODE: Impulsive
STRUCTURE: Navy blue wave 3
POSITION: Gray wave 1
DIRECTION NEXT LOWER DEGREES: Navy blue wave 4
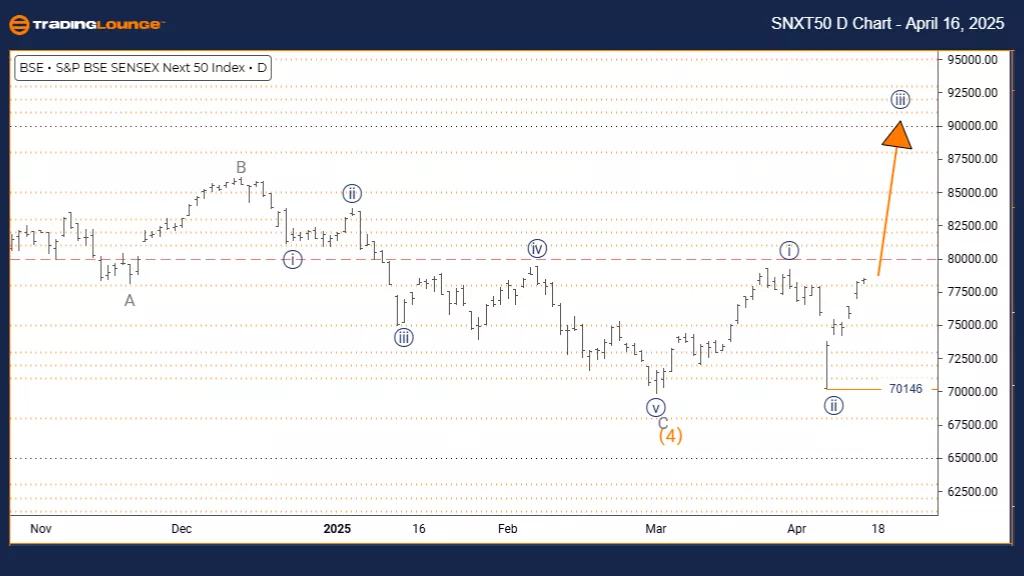
DETAILS: Navy blue wave 2 appears completed; navy blue wave 3 is now active.
Wave Cancel Invalid Level: 70146
The daily chart of the S&P BSE SENSEX NEXT 50 index shows a strong bullish trend forming within an impulsive Elliott Wave structure. The index has finished the correction phase of navy blue wave 2 and has entered navy blue wave 3, situated within the broader gray wave 1 pattern. This stage signals a powerful upward movement, typically marked by stronger momentum and extended price gains.
Navy blue wave 3 generally represents the most forceful phase of a bullish wave cycle. With wave 2 concluded, this sets up a robust advance, often surpassing the length and intensity of wave 1. The current pattern suggests continued upward pressure before the market enters the next corrective wave.
The next expected movement is navy blue wave 4, which will likely be a corrective pullback following the completion of wave 3. This short-term decline could offer potential buying opportunities before the uptrend resumes. The daily timeframe highlights this moment as a key phase within a broader upward trajectory.
Key Support Level:
The level to watch closely is 70146. If the index drops below this support, the current wave interpretation becomes invalid and will need to be reanalyzed. This level supports the low of wave 2 and acts as a safeguard for the ongoing bullish outlook.
What Traders Should Monitor:
Wave 3 typically shows consistent upward momentum and clear direction. Traders are advised to maintain bullish positions during this wave while staying alert for signs of its end. Confirmations should come from price action, momentum indicators, and volume trends, all of which can validate the strength and sustainability of the current move.
S&P BSE SENSEX NEXT 50 – Elliott Wave Analysis Trading Lounge Weekly Chart
S&P BSE SENSEX NEXT 50 Wave Technical Analysis
FUNCTION: Bullish Trend
MODE: Impulsive
STRUCTURE: Gray wave 1
POSITION: Orange wave 5
DIRECTION NEXT HIGHER DEGREES: Gray wave 1 (Started)
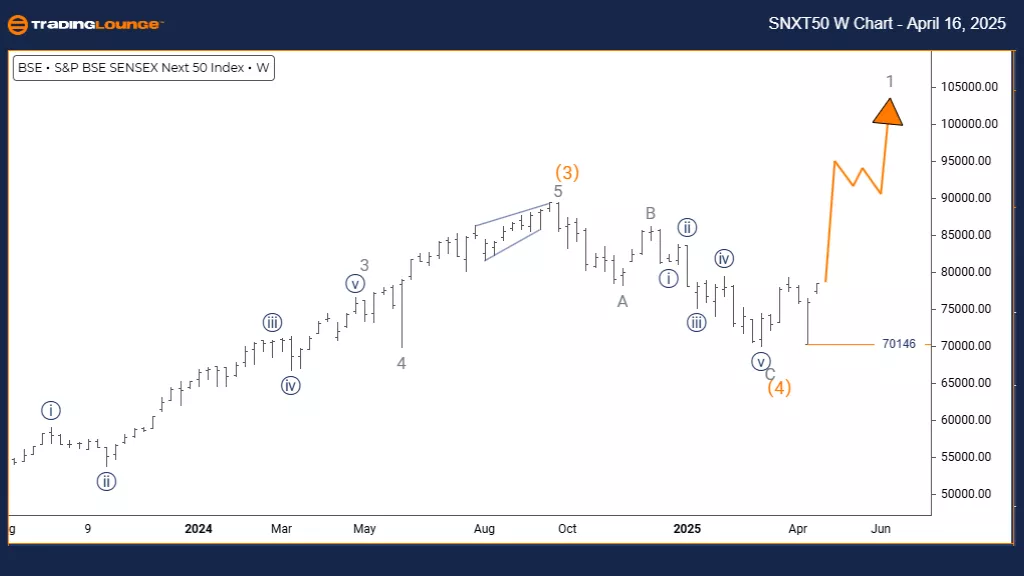
DETAILS: Orange wave 4 appears completed; gray wave 1 of 5 now active.
Wave Cancel Invalid Level: 70146
The weekly chart analysis of the S&P BSE SENSEX NEXT 50 shows a bullish trend developing through an impulsive Elliott Wave formation. The index has finished its orange wave 4 correction and entered gray wave 1, starting the final orange wave 5 sequence. This suggests the beginning of a potential final upward leg within the broader bullish trend.
Gray wave 1 represents the start of this final rise, often marked by increasing momentum. With the orange wave 4 correction behind, the market appears to be setting up for higher prices as this wave unfolds. The structure indicates that strong upward movement is likely to continue until the pattern completes.
Outlook and Critical Levels:
The weekly timeframe gives a broader view of the trend’s late-stage development. A key level to monitor is 70146—any drop below this point invalidates the current bullish scenario and would require a reevaluation of the wave structure.
Trading Implications:
Traders should look for signs typical of early wave 1 stages, such as consistent price increases and growing volume. The analysis supports holding bullish positions during this phase, while staying alert to potential volatility. Momentum indicators and price patterns will be essential in tracking the wave’s progression.
Completion of orange wave 5 would signal a likely larger trend reversal. Market participants should closely watch for classic signs of trend termination and divergence in momentum tools. This phase presents a key opportunity to engage with the final part of the bullish cycle while managing risk around the invalidation level.
Technical Analyst: Malik Awais
More By This Author:
Elliott Wave Technical Analysis: Solana Crypto Price News For Wednesday, April 16
Unlocking ASX Trading Success: Amcor Plc - Tuesday, April 15
Elliott Wave Technical Analysis: Fortinet Inc. - Tuesday, April 15


Comments
Log in or sign up to join the conversation.