
Pinduoduo Inc., Elliott Wave Technical Analysis, Monday, March 27

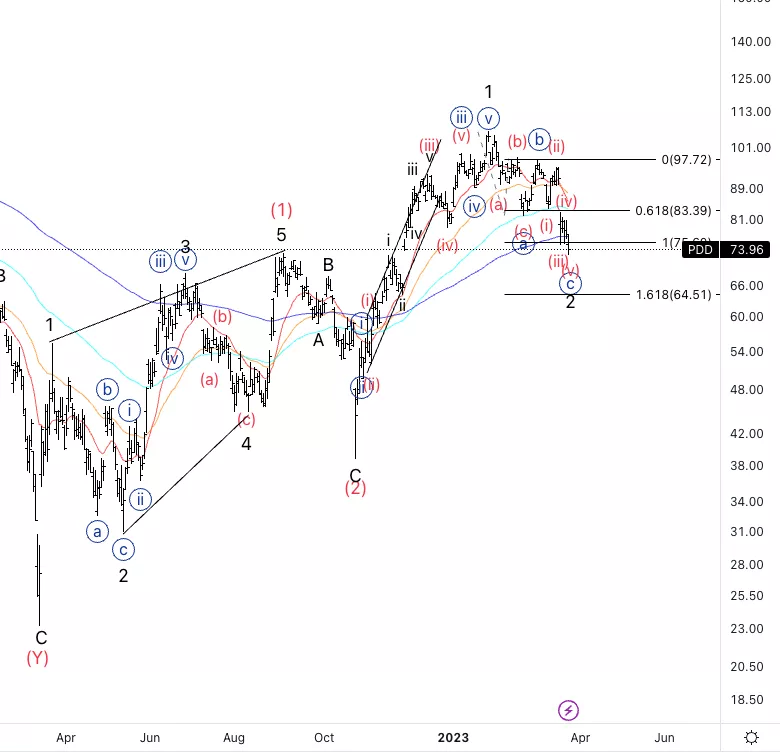
Pinduoduo Inc., (PDD): Daily Chart, 27 March 23,
PDD Stock Market Analysis: We can identify a clear three wave move to the downside into what could be wave 2. In addition to that, there seems to be a complete five wave pattern within wave {c}.
PDD Elliott Wave Count: Wave (v) of {c}.
PDD Technical Indicators: 200EMa as support.
PDD Trading Strategy: Looking for upside confirmation.
TradingLounge Analyst: Alessio Barretta
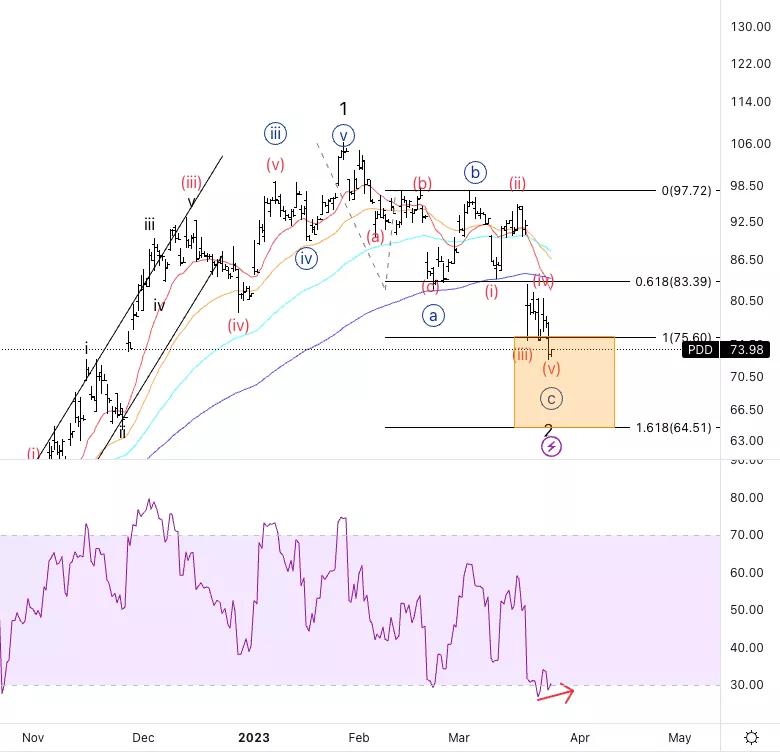
Pinduoduo Inc., PDD: 4-hour Chart, Monday, March 27
Pinduoduo Inc., Elliott Wave Technical Analysis
PDD Stock Market Analysis: We are looking at a potential bottom in place as we have passed equality of {c} vs. {a}.
PDD Elliott Wave count: Wave (v) of {c}.
PDD Technical Indicators: Below all averages with RSI bullish divergence.
PDD Trading Strategy: Looking for shorts as long as we stay below the 20EMA.
More By This Author:
Elliott Wave Technical Analysis: Ethereum /U.S. Dollar, Monday, March 27
US Stocks: Day Trading Strategy For Monday
Elliott Wave Technical Analysis: Twist Bioscience Corp.


Comments
Log in or sign up to join the conversation.