
DAX, FTSE Boom Faces Resistance After Strong Week Of Gains

European equities continue to whipsaw into the weekend after another volatile trading week. With DAX and CAC 40 holding onto four consecutive weeks of gains, FTSE 100 has made a decent recovery over the past two weeks.
To recap on the economic events that have rattled markets this week, the ECB rate decision and corporate earnings were met with mixed reactions from major stock indices that have priced in a large portion of geopolitical risks.
How Do politics and Central Banks Impact FX Markets? Visit DailyFX Education to Find Out
With the recent 75 basis point rate hike announced by ECB (European Central Bank) president Christine Lagarde already baked in, inflation data for both Germany and France has continued to soar.
(Click on image to enlarge)
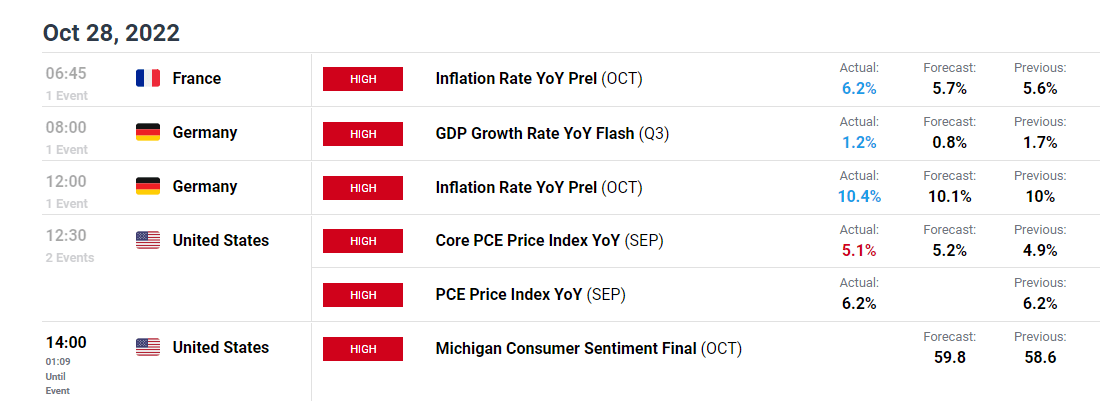
DailyFX Economic Calendar
GERMAN DAX TECHNICAL ANALYSIS
For the German Dax, the same levels of support and resistance recently discussed continue to hold. With bulls still grappling with wedge resistance at around the 13200 psychological level, a rejection of the descending trendline could see prices retreat towards 13000. For the upside to prevail, a break of 13200 and 13375 is still required with the next barrier holding at around 13572.
On the contrary, a break of the zone between 13115 and 12966 could provide further relief to bears.
German Dax 40 Weekly Chart
(Click on image to enlarge)
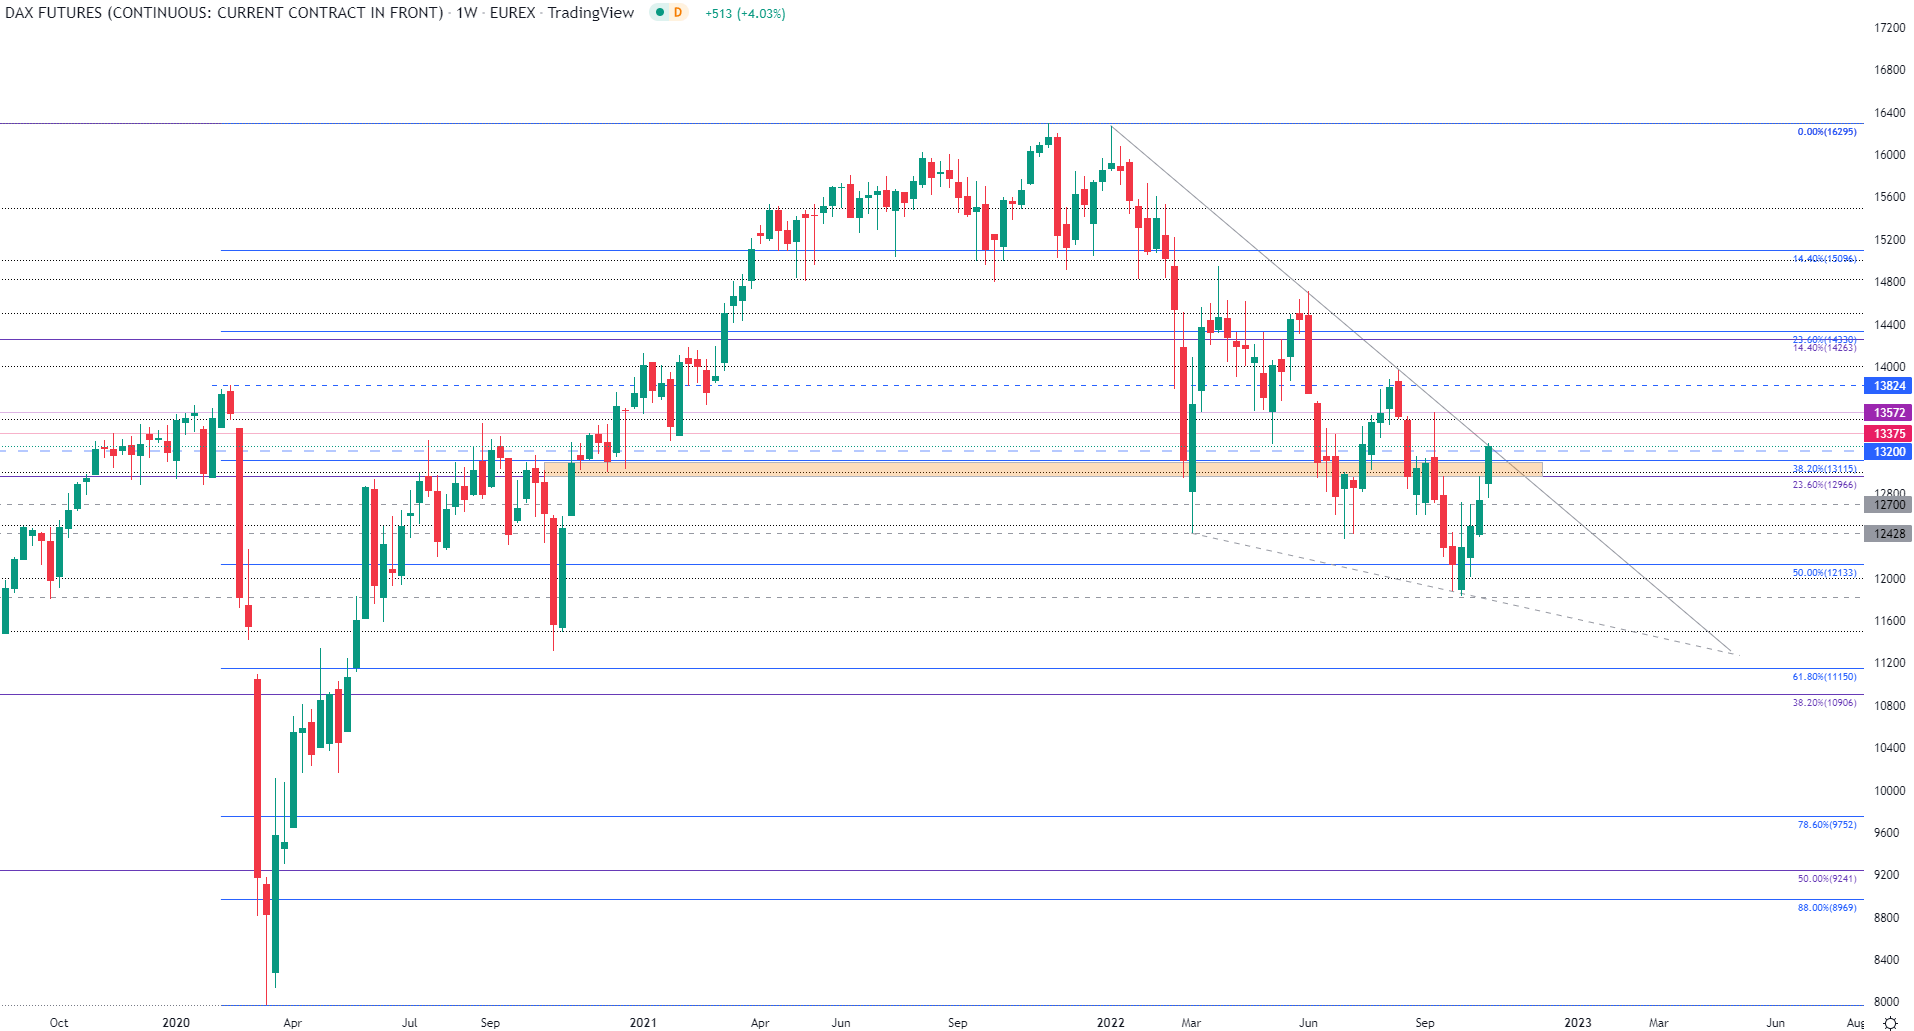
Chart prepared by Tammy Da Costa using TradingView
German Dax 40 Daily Chart
(Click on image to enlarge)
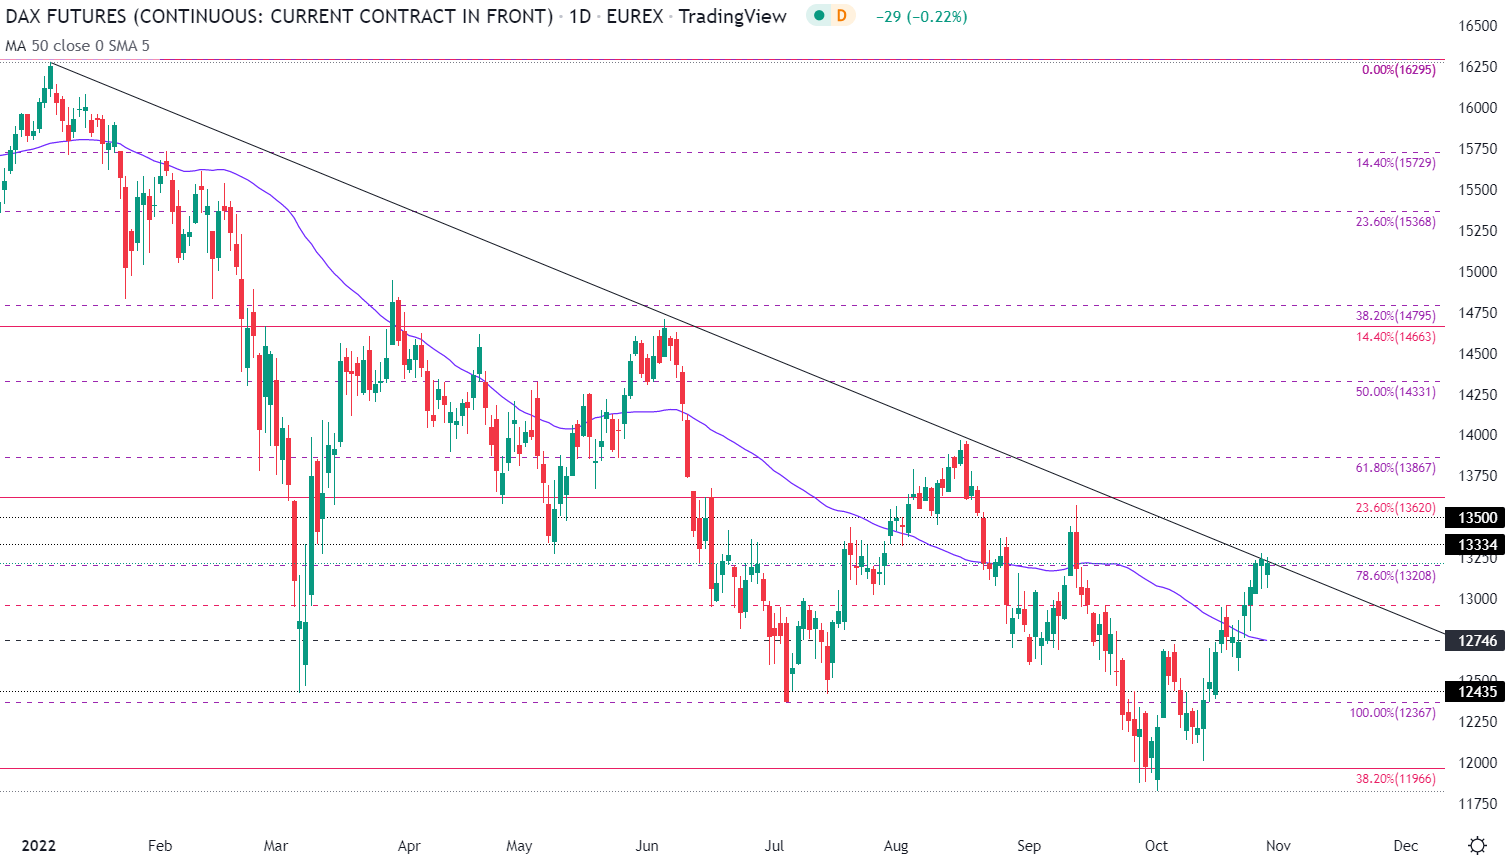
Chart prepared by Tammy Da Costa using TradingView
FTSE 100 TECHNICAL ANALYSIS
While the appointment of newly elected British Prime minister Rishi Sunak helped ease fears of continual political and economic uncertainty, the future trajectory of the United Kingdom remains unknown.
With the recent move above the 7000 psychological level providing a glimmer of hope for bulls, failure to drive prices above 7093 (the weekly high) has resulted in the formation of a candle that has engulfed the body of the prior candle (indicative of strong retaliation from bears).
FTSE 100 Daily Chart
(Click on image to enlarge)
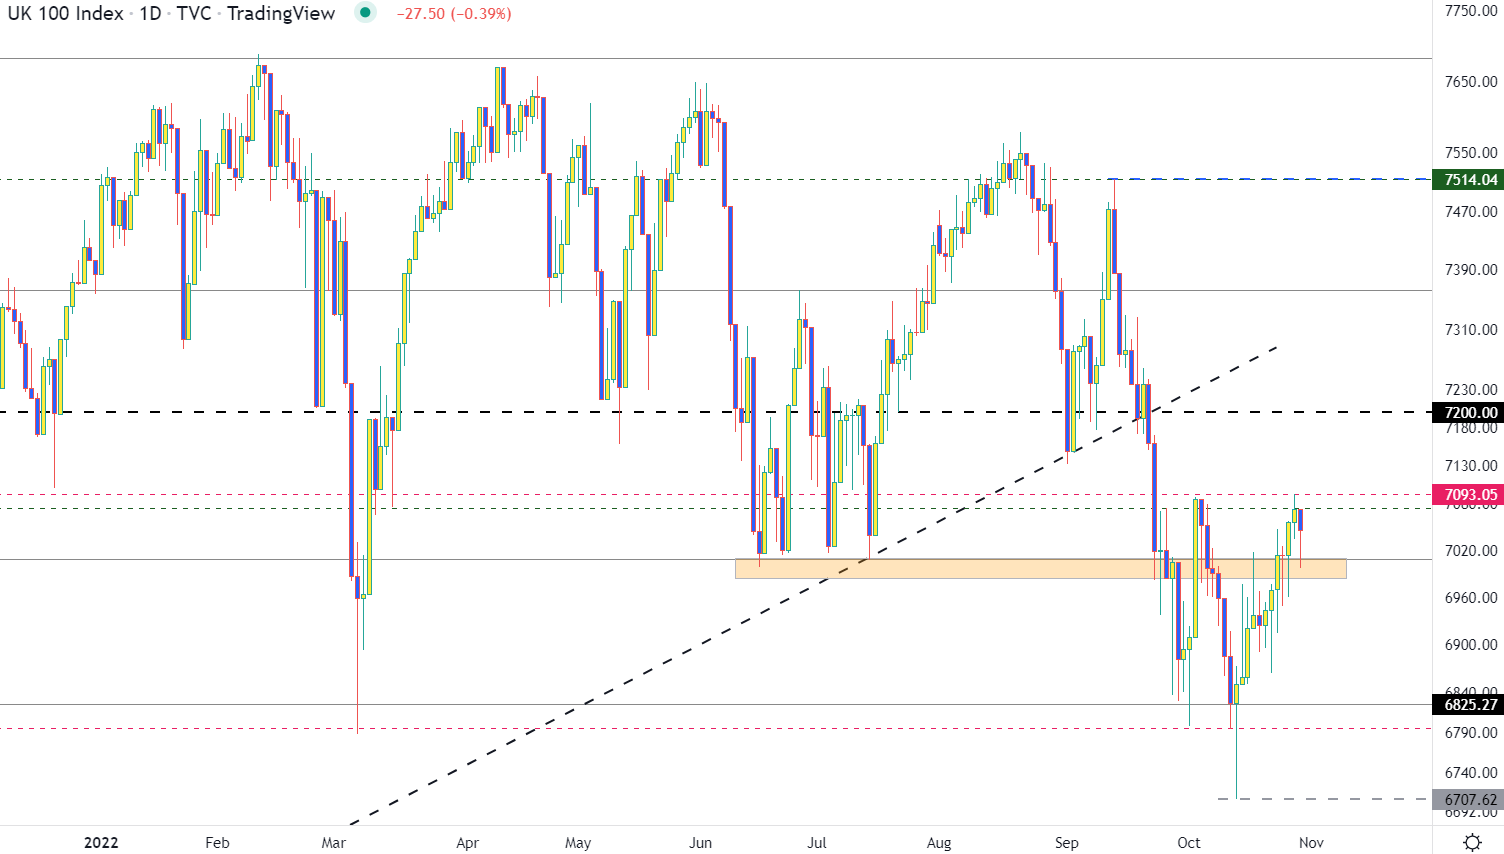
Chart prepared by Tammy Da Costa using TradingView
Much like the levels that have been discussed throughout the week, a move above this week’s high at 7093 draws attention to the psychological level of 7200.
If the downside persists, a move below 7000 and below 6850 could allow for a retest of 6825 and potential bearish continuation to the next zone of support at 6790.
More By This Author:
UK 100 Outlook: FTSE Recovery Provides a Glimmer of Hope to Bulls
BTC/USD Price Outlook: USD Strength & Rising Yields Hold Bitcoin Back
Disclosure: DailyForex will not be held liable for any loss or damage resulting from reliance on the information contained within this website including market news, analysis, trading signals ...
more

