Crude Oil Surges As US Dollar Wilts Under CPI Burden. Where To Next For WTI?
WTI crude oil benefitted from a US Dollar under attack in the wake of the highest headline US CPI in 39 years. It came in at 7% year-on-year to the end of December, which was in line with expectations. Core (ex food and energy) was 5.5%, slightly above the 5.4% anticipated.
Crude oil prices were given an extra boost by data from the Energy Information Administration (EIA) that showed stockpiles fell by more than expected last week.

Image Source: PixaBay
They decreased by 4.6 million barrels instead of a drop of 1.3 million barrels anticipated. Higher energy prices have the potential to further fuel inflationary pressures. The WTI futures contract made a high of USD 83.10 a barrel.
This also gave the oil exporting Canadian Dollar and Norwegian Krone an extra lift. The Australian Dollar was also higher with other commodities underpinned.
Copper rose over 3.5% overnight, while iron ore, aluminium and steel rebar were all stronger to varying degrees. Nickel is at its highest level since 2011. With the continuing spread of the Omicron variant, supply chain issues are re-emerging, forcing metal prices higher as fears of shortages grow.
The US Dollar made multi month lows against the Euro and Sterling, as well as the US Dollar index (DXY) itself.
Treasuries saw very little movement overall, but breakeven inflation rates went lower across the curve in anticipation of a Federal Reserve that is getting serious about tackling price pressures.
Crude Oil Technical Analysis
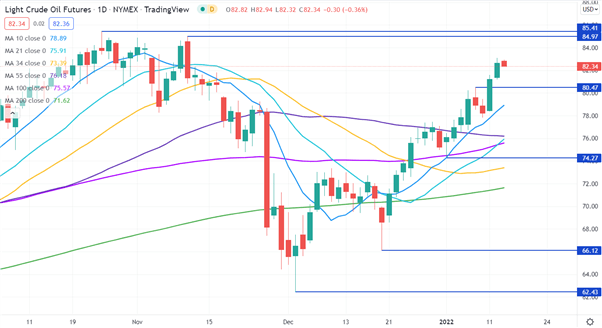
Crude oil has surged above all short, medium and long term simple moving averages (SMA) and appears set to test potential resistance at the November highs of 84.97 and 85.41.
While most SMAs have a positive gradient, the slope on the 55-day SMA remains negative. This may indicate that while there are some bullish momentum indicators in play, there is still some momentum headwinds.
Nearby support might be at the pivot point of 80.47 or at the recent low of 74.27.
(Click on image to enlarge)

Chart created in TradingView
APAC equities were mixed, with Chinese, Korean and Japanese stocks in the red, while Australian and Hong Kong indices finished slightly in the green.
After an address by the Bank of England’s Catherine Mann today, the US will see PPI and initial jobless claims data released.
Disclaimer: See the full disclosure for DailyFX here.


